6. Let g(x) = _z+3 2+3 a. What is the domain of g? b. Use a sequence of values near a = -3 to estimate
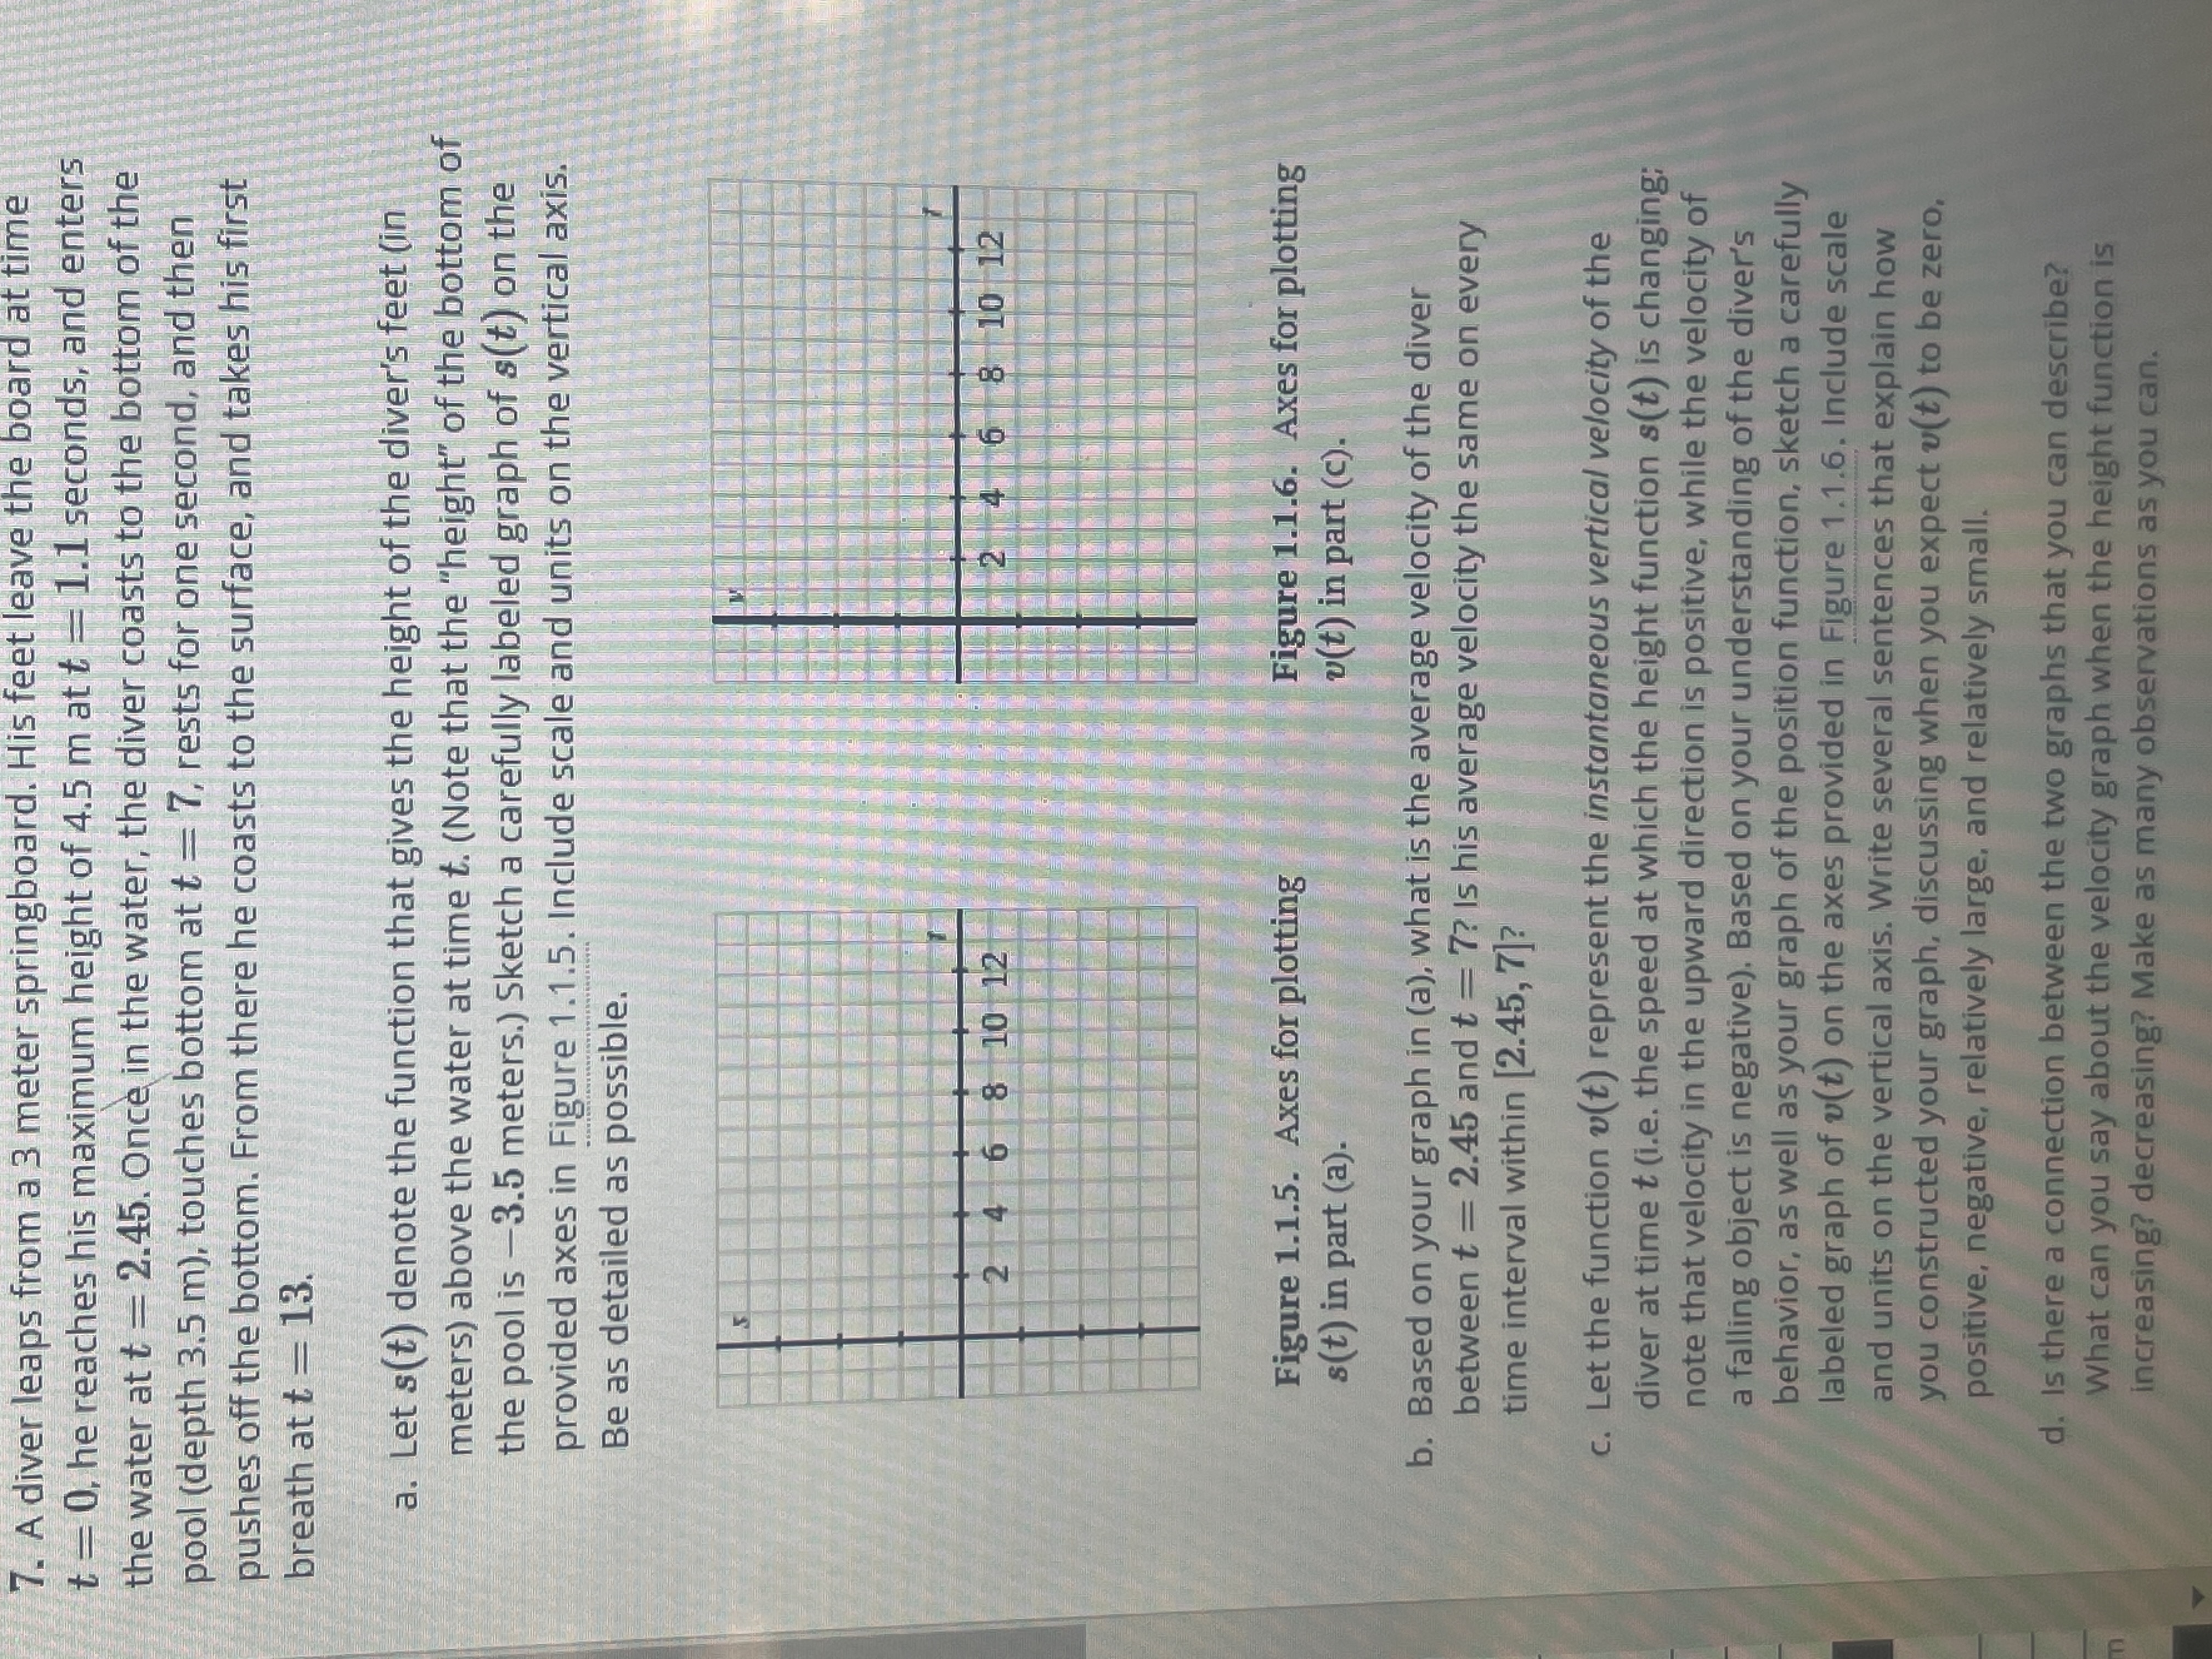
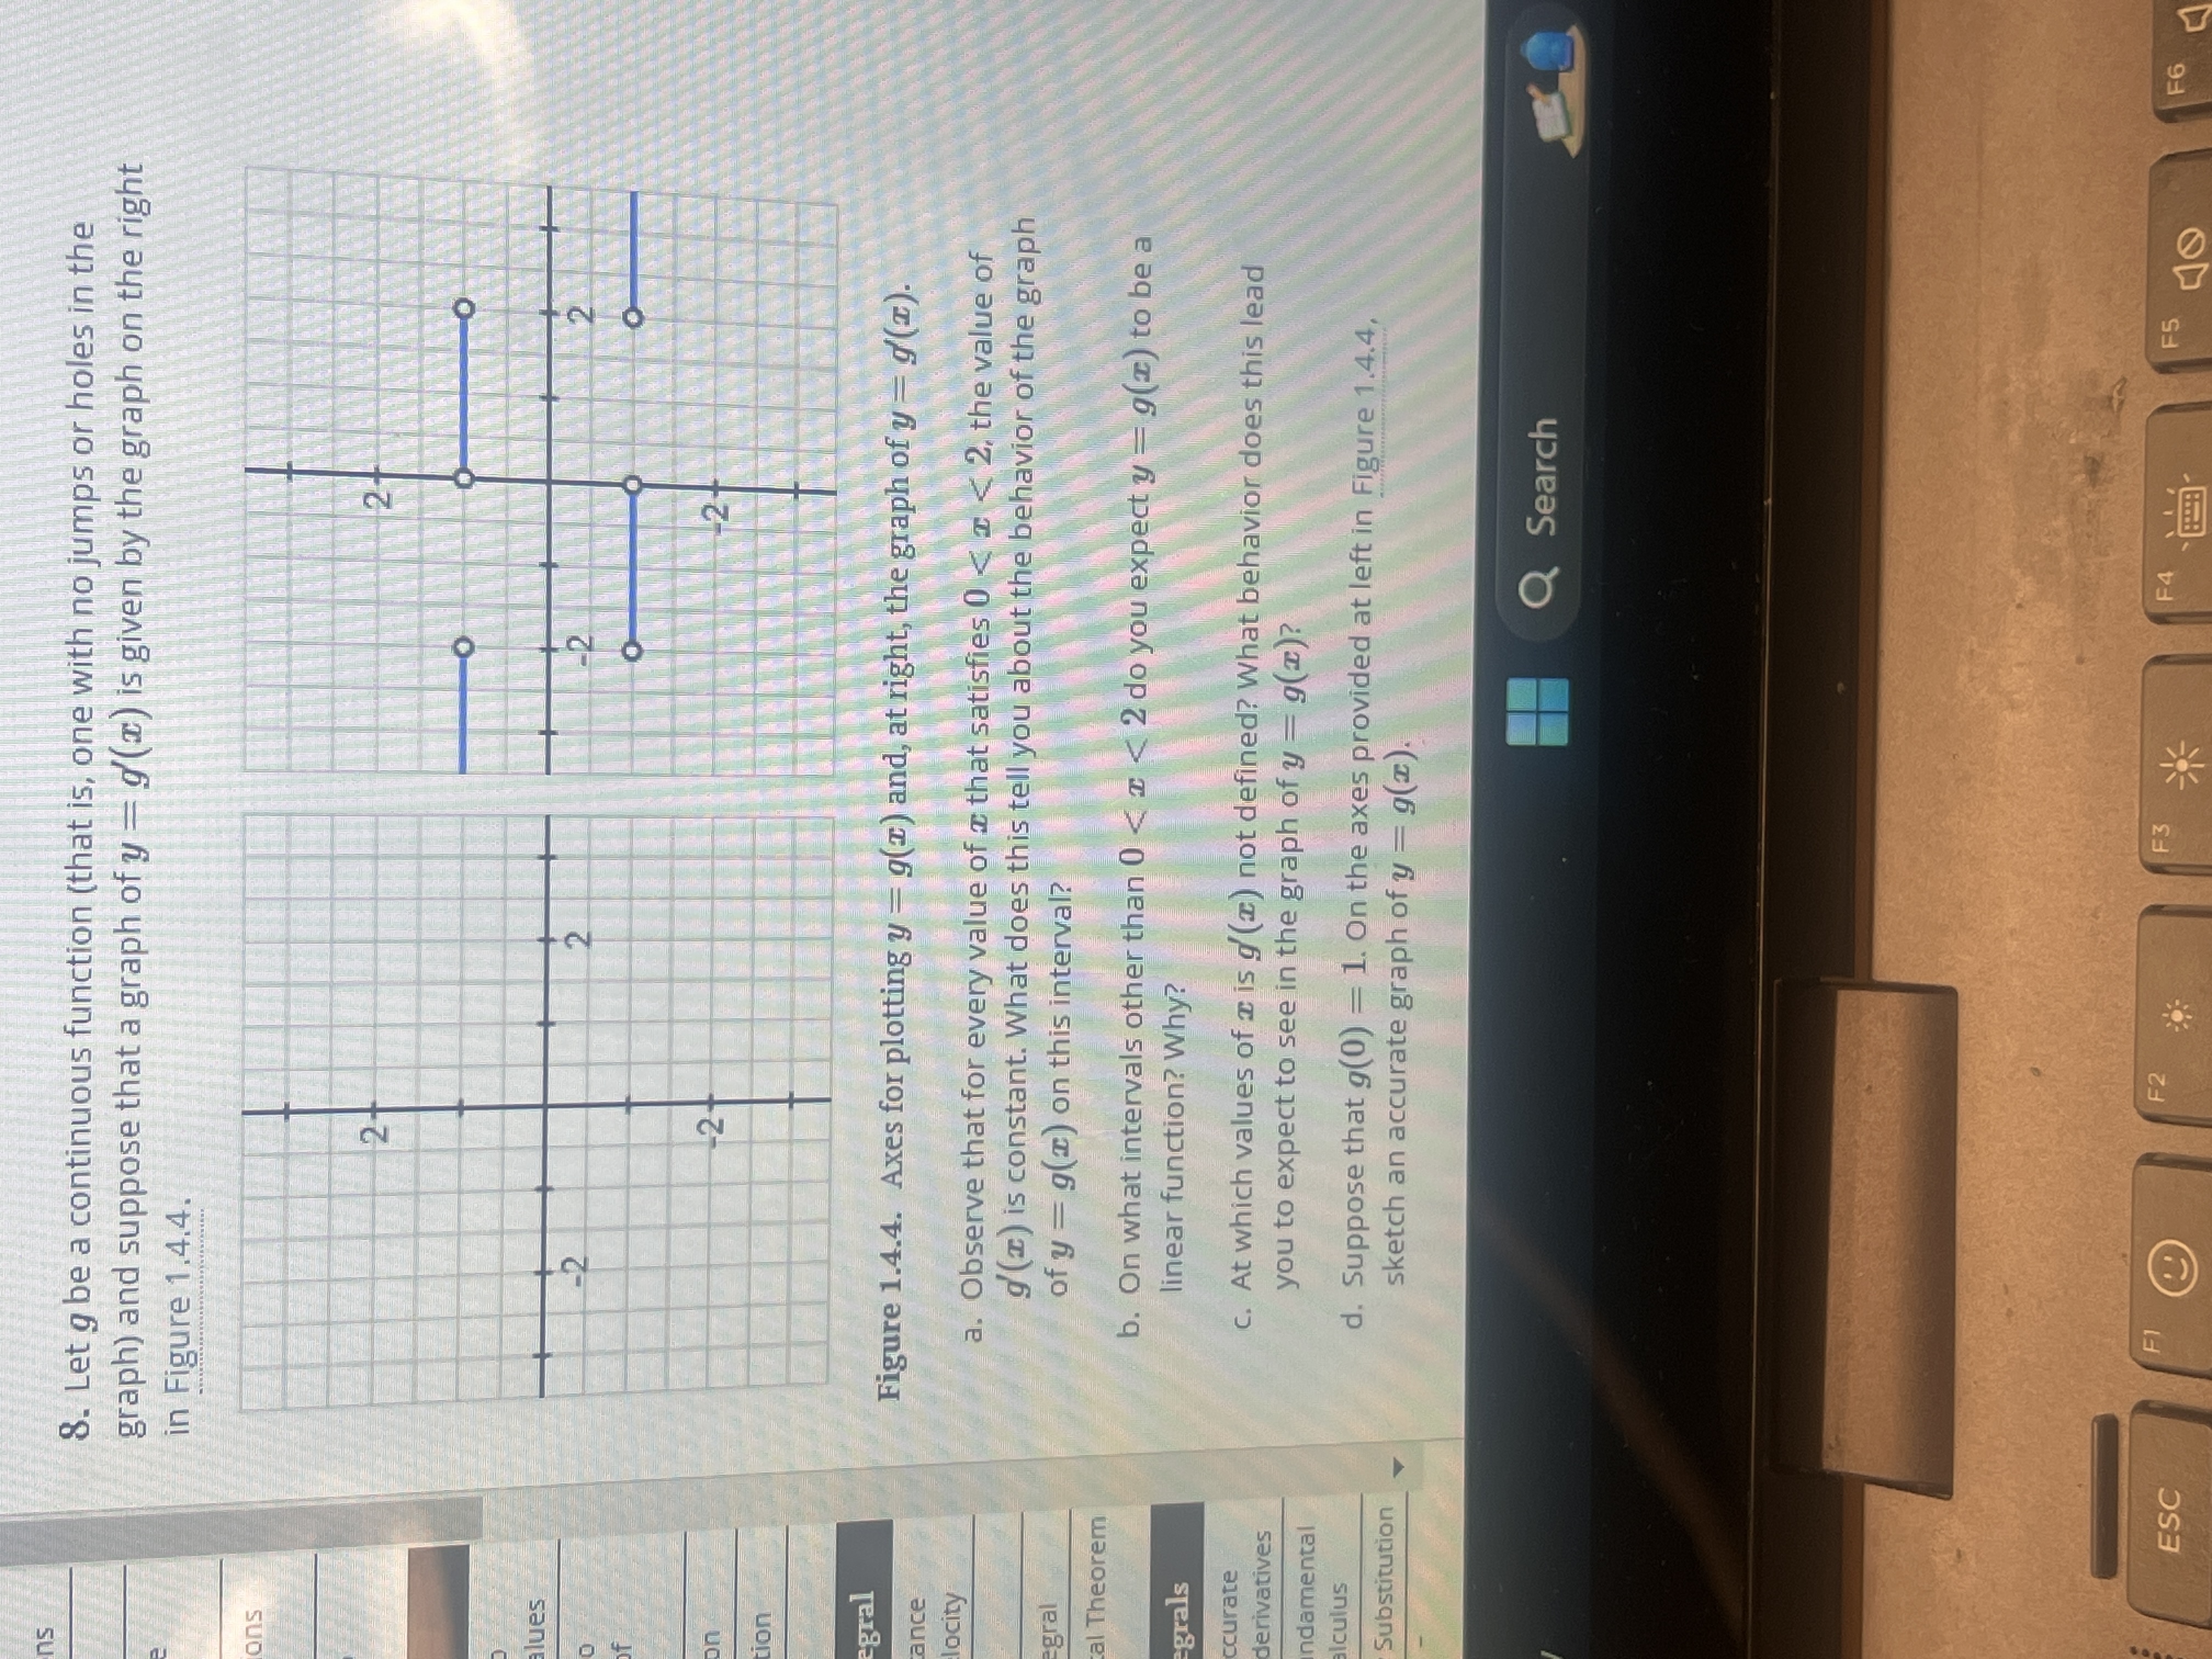
6. Let g(x) = _z+3 2+3 a. What is the domain of g? b. Use a sequence of values near a = -3 to estimate the value of lim,->-39(x), if you think the limit exists. If you think the limit doesn't exist, explain why. C. Use algebra to simplify the expression - 1+3 and hence work to evaluate limr-+-39(x) exactly, if it exists, or to explain how your work shows the limit fails to exist. Discuss how your findings compare to your results in (b). (Hint: |al = a whenever a 2 0, but la| = -a whenever a -39(x) Q Search F1 F2 F3 F4 F5 F6 F7 a $ % & 2 3 4 5 68. Suppose that the population, P, of China (in billions) can be approximated by the function P(t) = 1.15(1.014)* where t is the number of years since the start of 1993. a. According to the model, what was the total change in the population of China between January 1, 1993 and January 1, 2000? What will be the average rate of change of the population over this time period? Is this average rate of change greater or less than the instantaneous rate of change of the population on January 1, 2000? Explain and justify, being sure to include proper units on all your answers. b. According to the model, what is the average rate of change of the population of China in the ten-year period starting on January 1, 2012? c. Write an expression involving limits that, if evaluated, would give the exact instantaneous rate of change of the population on today's date. Then estimate the value of this limit (discuss how you chose to do so) and explain the meaning (including units) of the value you have found. be d. Find an equation for the tangent line to the function y = P(t) at the point where the t-value is given by today's date. Q Search F5 F6 F8 F9 144 @ % & K 2 3 4 5 6 8 Q W E R T Y U A S D F G7. A diver leaps from a 3 meter springboard. His feet leave the board at time t = 0, he reaches his maximum height of 4.5 m at t = 1.1 seconds, and enters the water at t = 2.45. Once in the water, the diver coasts to the bottom of the pool (depth 3.5 m), touches bottom at t = 7, rests for one second, and then pushes off the bottom. From there he coasts to the surface, and takes his first breath at t = 13. a. Let s(t) denote the function that gives the height of the diver's feet (in meters) above the water at time t. (Note that the "height" of the bottom of the pool is -3.5 meters.) Sketch a carefully labeled graph of s(t) on the provided axes in Figure 1.1.5. Include scale and units on the vertical axis. Be as detailed as possible. 2 4 6 8 10 12 24 6 8 10 12 Figure 1.1.5. Axes for plotting Figure 1.1.6. Axes for plotting s(t) in part (a). v(t) in part (C). b. Based on your graph in (a), what is the average velocity of the diver between t = 2.45 and t = 7? Is his average velocity the same on every time interval within [2.45, 7]? c. Let the function v(t) represent the instantaneous vertical velocity of the diver at time t (i.e. the speed at which the height function s(t) is changing; note that velocity in the upward direction is positive, while the velocity of a falling object is negative). Based on your understanding of the diver's behavior, as well as your graph of the position function, sketch a carefully labeled graph of v(t) on the axes provided in Figure 1.1.6. Include scale and units on the vertical axis. Write several sentences that explain how you constructed your graph, discussing when you expect v(t) to be zero, positive, negative, relatively large, and relatively small. d. Is there a connection between the two graphs that you can describe? What can you say about the velocity graph when the height function is increasing? decreasing? Make as many observations as you can.8. Let g be a continuous function (that is, one with no jumps or holes in the graph) and suppose that a graph of y - 9 (x) is given by the graph on the right in Figure 1.4.4. Ions 2 - lues 2 Ion egral Figure 1.4.4. Axes for plotting y = g(I) and, at right, the graph of y = (I). ance locity a. Observe that for every value of a that satisfies 0
Step by Step Solution
There are 3 Steps involved in it
Step: 1
Get Instant Access to Expert-Tailored Solutions
See step-by-step solutions with expert insights and AI powered tools for academic success
Step: 2
Step: 3
Ace Your Homework with AI
Get the answers you need in no time with our AI-driven, step-by-step assistance