6 Please Help
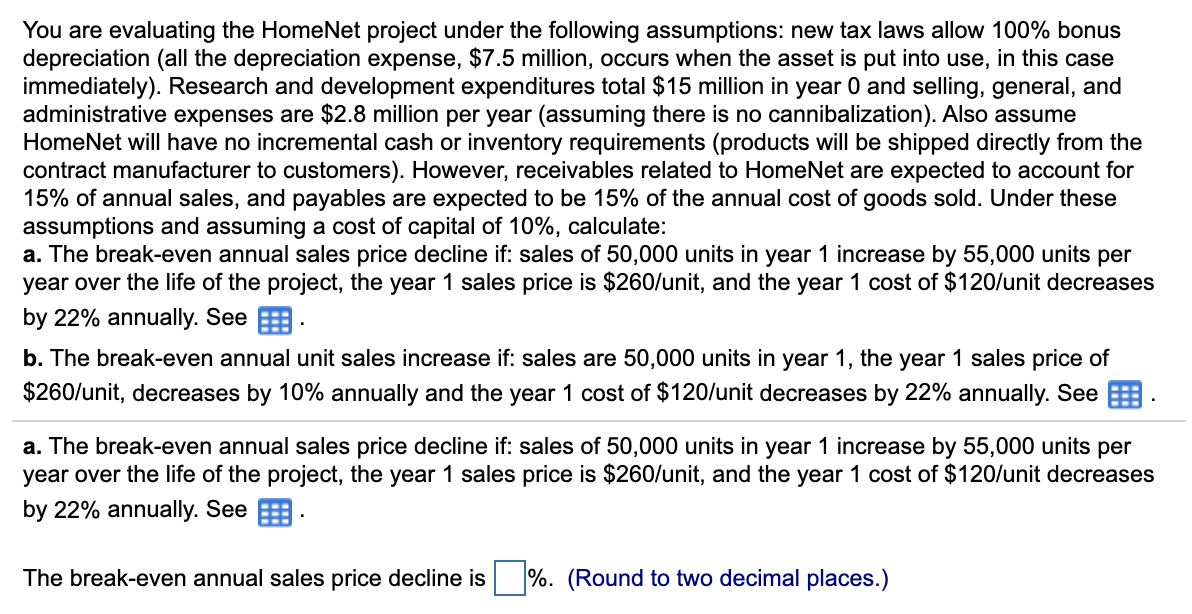 Chart for a) below
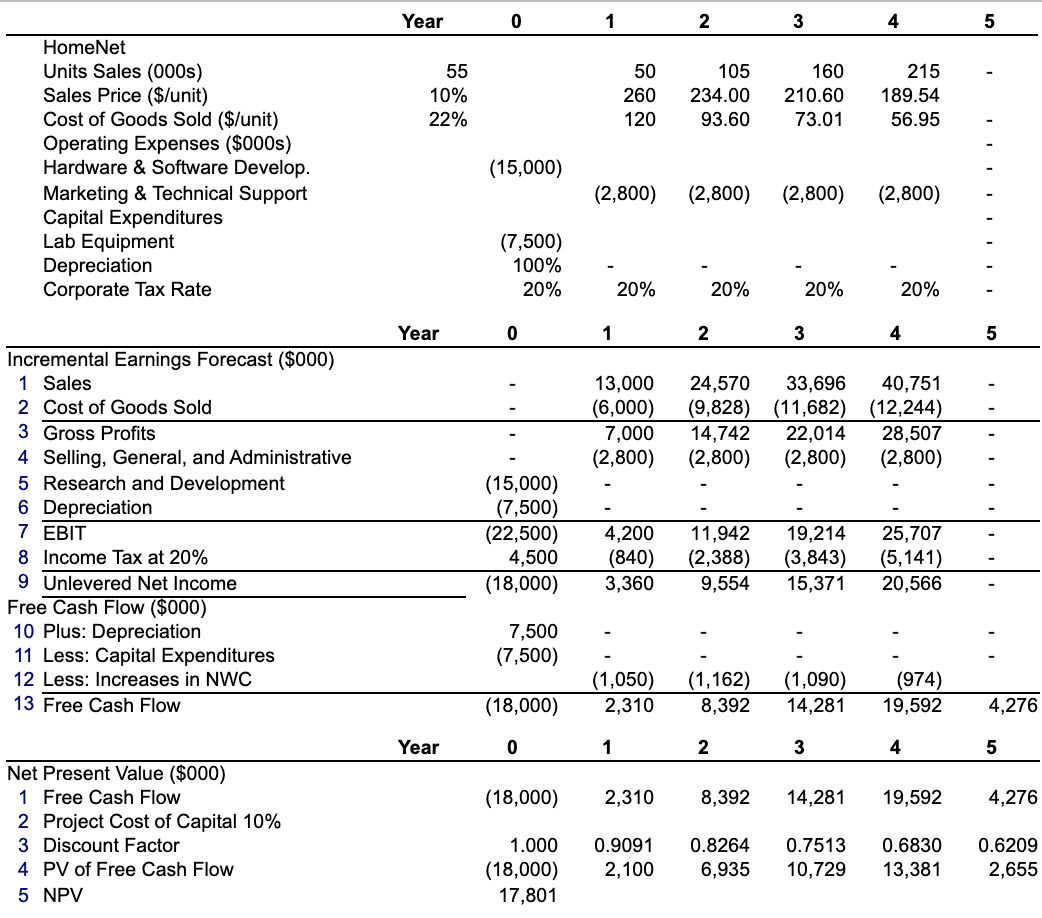
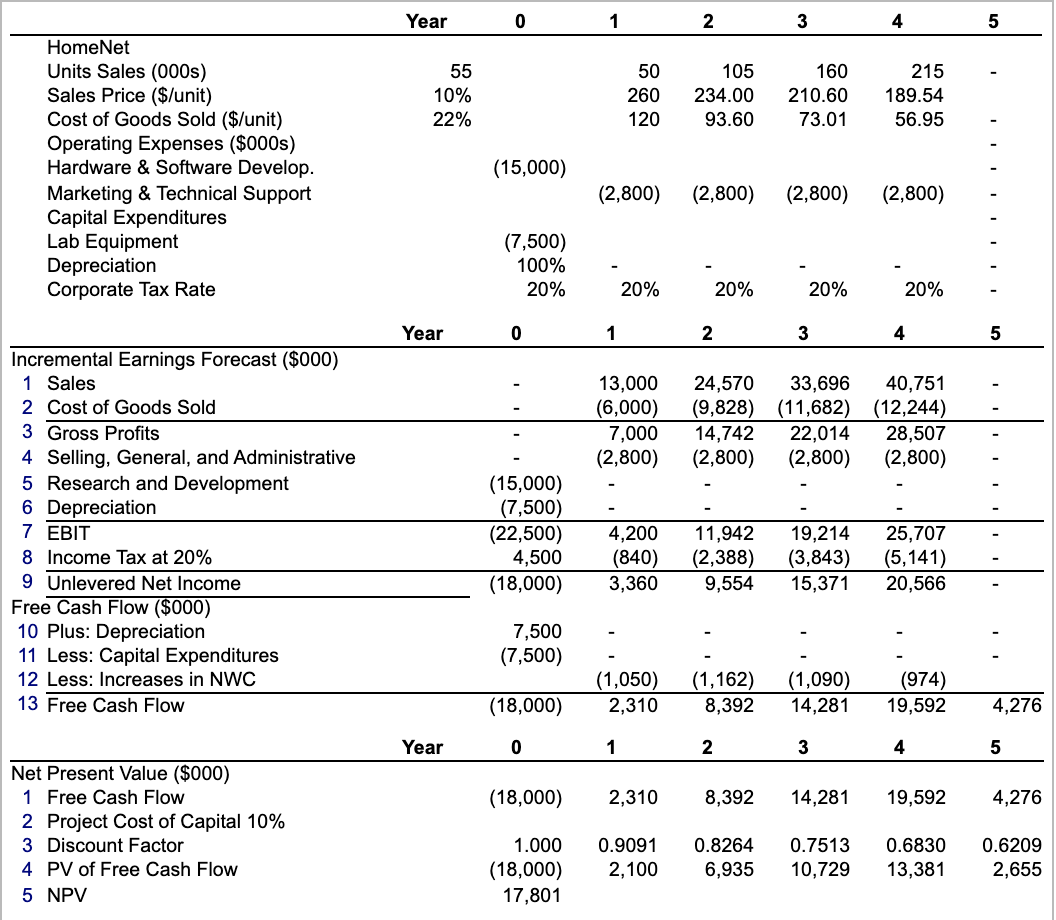 Chart for b) below
You are evaluating the HomeNet project under the following assumptions: new tax laws allow 100% bonus depreciation (all the depreciation expense, $7.5 million, occurs when the asset is put into use, in this case immediately). Research and development expenditures total $15 million in year 0 and selling, general, and administrative expenses are $2.8 million per year (assuming there is no cannibalization). Also assume HomeNet will have no incremental cash or inventory requirements (products will be shipped directly from the contract manufacturer to customers). However, receivables related to HomeNet are expected to account for 15% of annual sales, and payables are expected to be 15% of the annual cost of goods sold. Under these assumptions and assuming a cost of capital of 10%, calculate: a. The break-even annual sales price decline if: sales of 50,000 units in year 1 increase by 55,000 units per year over the life of the project, the year 1 sales price is $260/unit, and the year 1 cost of $120/unit decreases by 22% annually. See b. The break-even annual unit sales increase if: sales are 50,000 units in year 1, the year 1 sales price of $260/unit, decreases by 10% annually and the year 1 cost of $120/unit decreases by 22% annually. See a. The break-even annual sales price decline if: sales of 50,000 units in year 1 increase by 55,000 units per year over the life of the project, the year 1 sales price is $260/unit, and the year 1 cost of $120/unit decreases by 22% annually. See 5. The break-even annual sales price decline is %. (Round to two decimal places.) Year 0 1 2 3 4 5 55 10% 22% 50 260 120 105 234.00 93.60 160 210.60 73.01 215 189.54 56.95 HomeNet Units Sales (000s) Sales Price ($/unit) Cost of Goods Sold ($/unit) Operating Expenses ($000s) Hardware & Software Develop. Marketing & Technical Support Capital Expenditures Lab Equipment Depreciation Corporate Tax Rate (15,000) (2,800) (2,800) (2,800) (2,800) (7,500) 100% 20% 20% 20% 20% 20% Year 0 1 2 3 4 5 13,000 (6,000) 7,000 (2,800) 24,570 33,696 40,751 (9,828) (11,682) (12,244) 14,742 22,014 28,507 (2,800) (2,800) (2,800) Incremental Earnings Forecast ($000) 1 Sales 2 Cost of Goods Sold 3 Gross Profits 4 Selling, General, and Administrative 5 Research and Development 6 Depreciation 7 EBIT 8 Income Tax at 20% 9 Unlevered Net Income Free Cash Flow ($000) 10 Plus: Depreciation 11 Less: Capital Expenditures 12 Less: Increases in NWC 13 Free Cash Flow (15,000) (7,500) (22,500) 4,500 (18,000) 4,200 (840) 3,360 11,942 (2,388) 9,554 19,214 (3,843) 15,371 25,707 (5,141) 20,566 7,500 (7,500) (1,050) 2,310 (1,162) 8,392 (1,090) 14,281 (974) 19,592 (18,000) 4,276 Year 0 1 2 3 4 5 (18,000) 2,310 8,392 14,281 19,592 4,276 Net Present Value ($000) 1 Free Cash Flow 2 Project Cost of Capital 10% 3 Discount Factor 4 PV of Free Cash Flow 5 NPV 1.000 (18,000) 17,801 0.9091 2,100 0.8264 6,935 0.7513 10,729 0.6830 13,381 0.6209 2,655 Year 0 1 2 3 5 55 10% 22% 50 260 120 105 234.00 93.60 160 210.60 73.01 215 189.54 56.95 HomeNet Units Sales (000s) Sales Price ($/unit) Cost of Goods Sold ($/unit) Operating Expenses ($000s) Hardware & Software Develop. Marketing & Technical Support Capital Expenditures Lab Equipment Depreciation Corporate Tax Rate (15,000) (2,800) (2,800) (2,800) (2,800) (7,500) 100% 20% 20% 20% 20% 20% Year 0 1 2 3 4 5 13,000 (6,000) 7,000 (2,800) 24,570 (9,828) 14,742 (2,800) 33,696 (11,682) 22,014 (2,800) 40,751 (12,244) 28,507 (2,800) Incremental Earnings Forecast ($000) 1 Sales 2 Cost of Goods Sold 3 Gross Profits 4 Selling, General, and Administrative 5 Research and Development 6 Depreciation 7 EBIT 8 Income Tax at 20% 9 Unlevered Net Income Free Cash Flow ($000) 10 Plus: Depreciation 11 Less: Capital Expenditures 12 Less: Increases in NWC 13 Free Cash Flow (15,000) (7,500) (22,500) 4,500 (18,000) 4,200 (840) 3,360 11,942 (2,388) 9,554 19,214 (3,843) 15,371 25,707 (5,141) 20,566 7,500 (7,500) (1,050) 2,310 (1,162) 8,392 (1,090) 14,281 (974) 19,592 (18,000) 4,276 Year 0 1 2 3 4 5 (18,000) 2,310 8,392 14,281 19,592 4,276 Net Present Value ($000) 1 Free Cash Flow 2 Project Cost of Capital 10% 3 Discount Factor 4 PV of Free Cash Flow 5 NPV 1.000 (18,000) 17,801 0.9091 2,100 0.8264 6,935 0.7513 10,729 0.6830 13,381 0.6209 2,655 You are evaluating the HomeNet project under the following assumptions: new tax laws allow 100% bonus depreciation (all the depreciation expense, $7.5 million, occurs when the asset is put into use, in this case immediately). Research and development expenditures total $15 million in year 0 and selling, general, and administrative expenses are $2.8 million per year (assuming there is no cannibalization). Also assume HomeNet will have no incremental cash or inventory requirements (products will be shipped directly from the contract manufacturer to customers). However, receivables related to HomeNet are expected to account for 15% of annual sales, and payables are expected to be 15% of the annual cost of goods sold. Under these assumptions and assuming a cost of capital of 10%, calculate: a. The break-even annual sales price decline if: sales of 50,000 units in year 1 increase by 55,000 units per year over the life of the project, the year 1 sales price is $260/unit, and the year 1 cost of $120/unit decreases by 22% annually. See b. The break-even annual unit sales increase if: sales are 50,000 units in year 1, the year 1 sales price of $260/unit, decreases by 10% annually and the year 1 cost of $120/unit decreases by 22% annually. See a. The break-even annual sales price decline if: sales of 50,000 units in year 1 increase by 55,000 units per year over the life of the project, the year 1 sales price is $260/unit, and the year 1 cost of $120/unit decreases by 22% annually. See 5. The break-even annual sales price decline is %. (Round to two decimal places.) Year 0 1 2 3 4 5 55 10% 22% 50 260 120 105 234.00 93.60 160 210.60 73.01 215 189.54 56.95 HomeNet Units Sales (000s) Sales Price ($/unit) Cost of Goods Sold ($/unit) Operating Expenses ($000s) Hardware & Software Develop. Marketing & Technical Support Capital Expenditures Lab Equipment Depreciation Corporate Tax Rate (15,000) (2,800) (2,800) (2,800) (2,800) (7,500) 100% 20% 20% 20% 20% 20% Year 0 1 2 3 4 5 13,000 (6,000) 7,000 (2,800) 24,570 33,696 40,751 (9,828) (11,682) (12,244) 14,742 22,014 28,507 (2,800) (2,800) (2,800) Incremental Earnings Forecast ($000) 1 Sales 2 Cost of Goods Sold 3 Gross Profits 4 Selling, General, and Administrative 5 Research and Development 6 Depreciation 7 EBIT 8 Income Tax at 20% 9 Unlevered Net Income Free Cash Flow ($000) 10 Plus: Depreciation 11 Less: Capital Expenditures 12 Less: Increases in NWC 13 Free Cash Flow (15,000) (7,500) (22,500) 4,500 (18,000) 4,200 (840) 3,360 11,942 (2,388) 9,554 19,214 (3,843) 15,371 25,707 (5,141) 20,566 7,500 (7,500) (1,050) 2,310 (1,162) 8,392 (1,090) 14,281 (974) 19,592 (18,000) 4,276 Year 0 1 2 3 4 5 (18,000) 2,310 8,392 14,281 19,592 4,276 Net Present Value ($000) 1 Free Cash Flow 2 Project Cost of Capital 10% 3 Discount Factor 4 PV of Free Cash Flow 5 NPV 1.000 (18,000) 17,801 0.9091 2,100 0.8264 6,935 0.7513 10,729 0.6830 13,381 0.6209 2,655 Year 0 1 2 3 5 55 10% 22% 50 260 120 105 234.00 93.60 160 210.60 73.01 215 189.54 56.95 HomeNet Units Sales (000s) Sales Price ($/unit) Cost of Goods Sold ($/unit) Operating Expenses ($000s) Hardware & Software Develop. Marketing & Technical Support Capital Expenditures Lab Equipment Depreciation Corporate Tax Rate (15,000) (2,800) (2,800) (2,800) (2,800) (7,500) 100% 20% 20% 20% 20% 20% Year 0 1 2 3 4 5 13,000 (6,000) 7,000 (2,800) 24,570 (9,828) 14,742 (2,800) 33,696 (11,682) 22,014 (2,800) 40,751 (12,244) 28,507 (2,800) Incremental Earnings Forecast ($000) 1 Sales 2 Cost of Goods Sold 3 Gross Profits 4 Selling, General, and Administrative 5 Research and Development 6 Depreciation 7 EBIT 8 Income Tax at 20% 9 Unlevered Net Income Free Cash Flow ($000) 10 Plus: Depreciation 11 Less: Capital Expenditures 12 Less: Increases in NWC 13 Free Cash Flow (15,000) (7,500) (22,500) 4,500 (18,000) 4,200 (840) 3,360 11,942 (2,388) 9,554 19,214 (3,843) 15,371 25,707 (5,141) 20,566 7,500 (7,500) (1,050) 2,310 (1,162) 8,392 (1,090) 14,281 (974) 19,592 (18,000) 4,276 Year 0 1 2 3 4 5 (18,000) 2,310 8,392 14,281 19,592 4,276 Net Present Value ($000) 1 Free Cash Flow 2 Project Cost of Capital 10% 3 Discount Factor 4 PV of Free Cash Flow 5 NPV 1.000 (18,000) 17,801 0.9091 2,100 0.8264 6,935 0.7513 10,729 0.6830 13,381 0.6209 2,655