Answered step by step
Verified Expert Solution
Question
1 Approved Answer
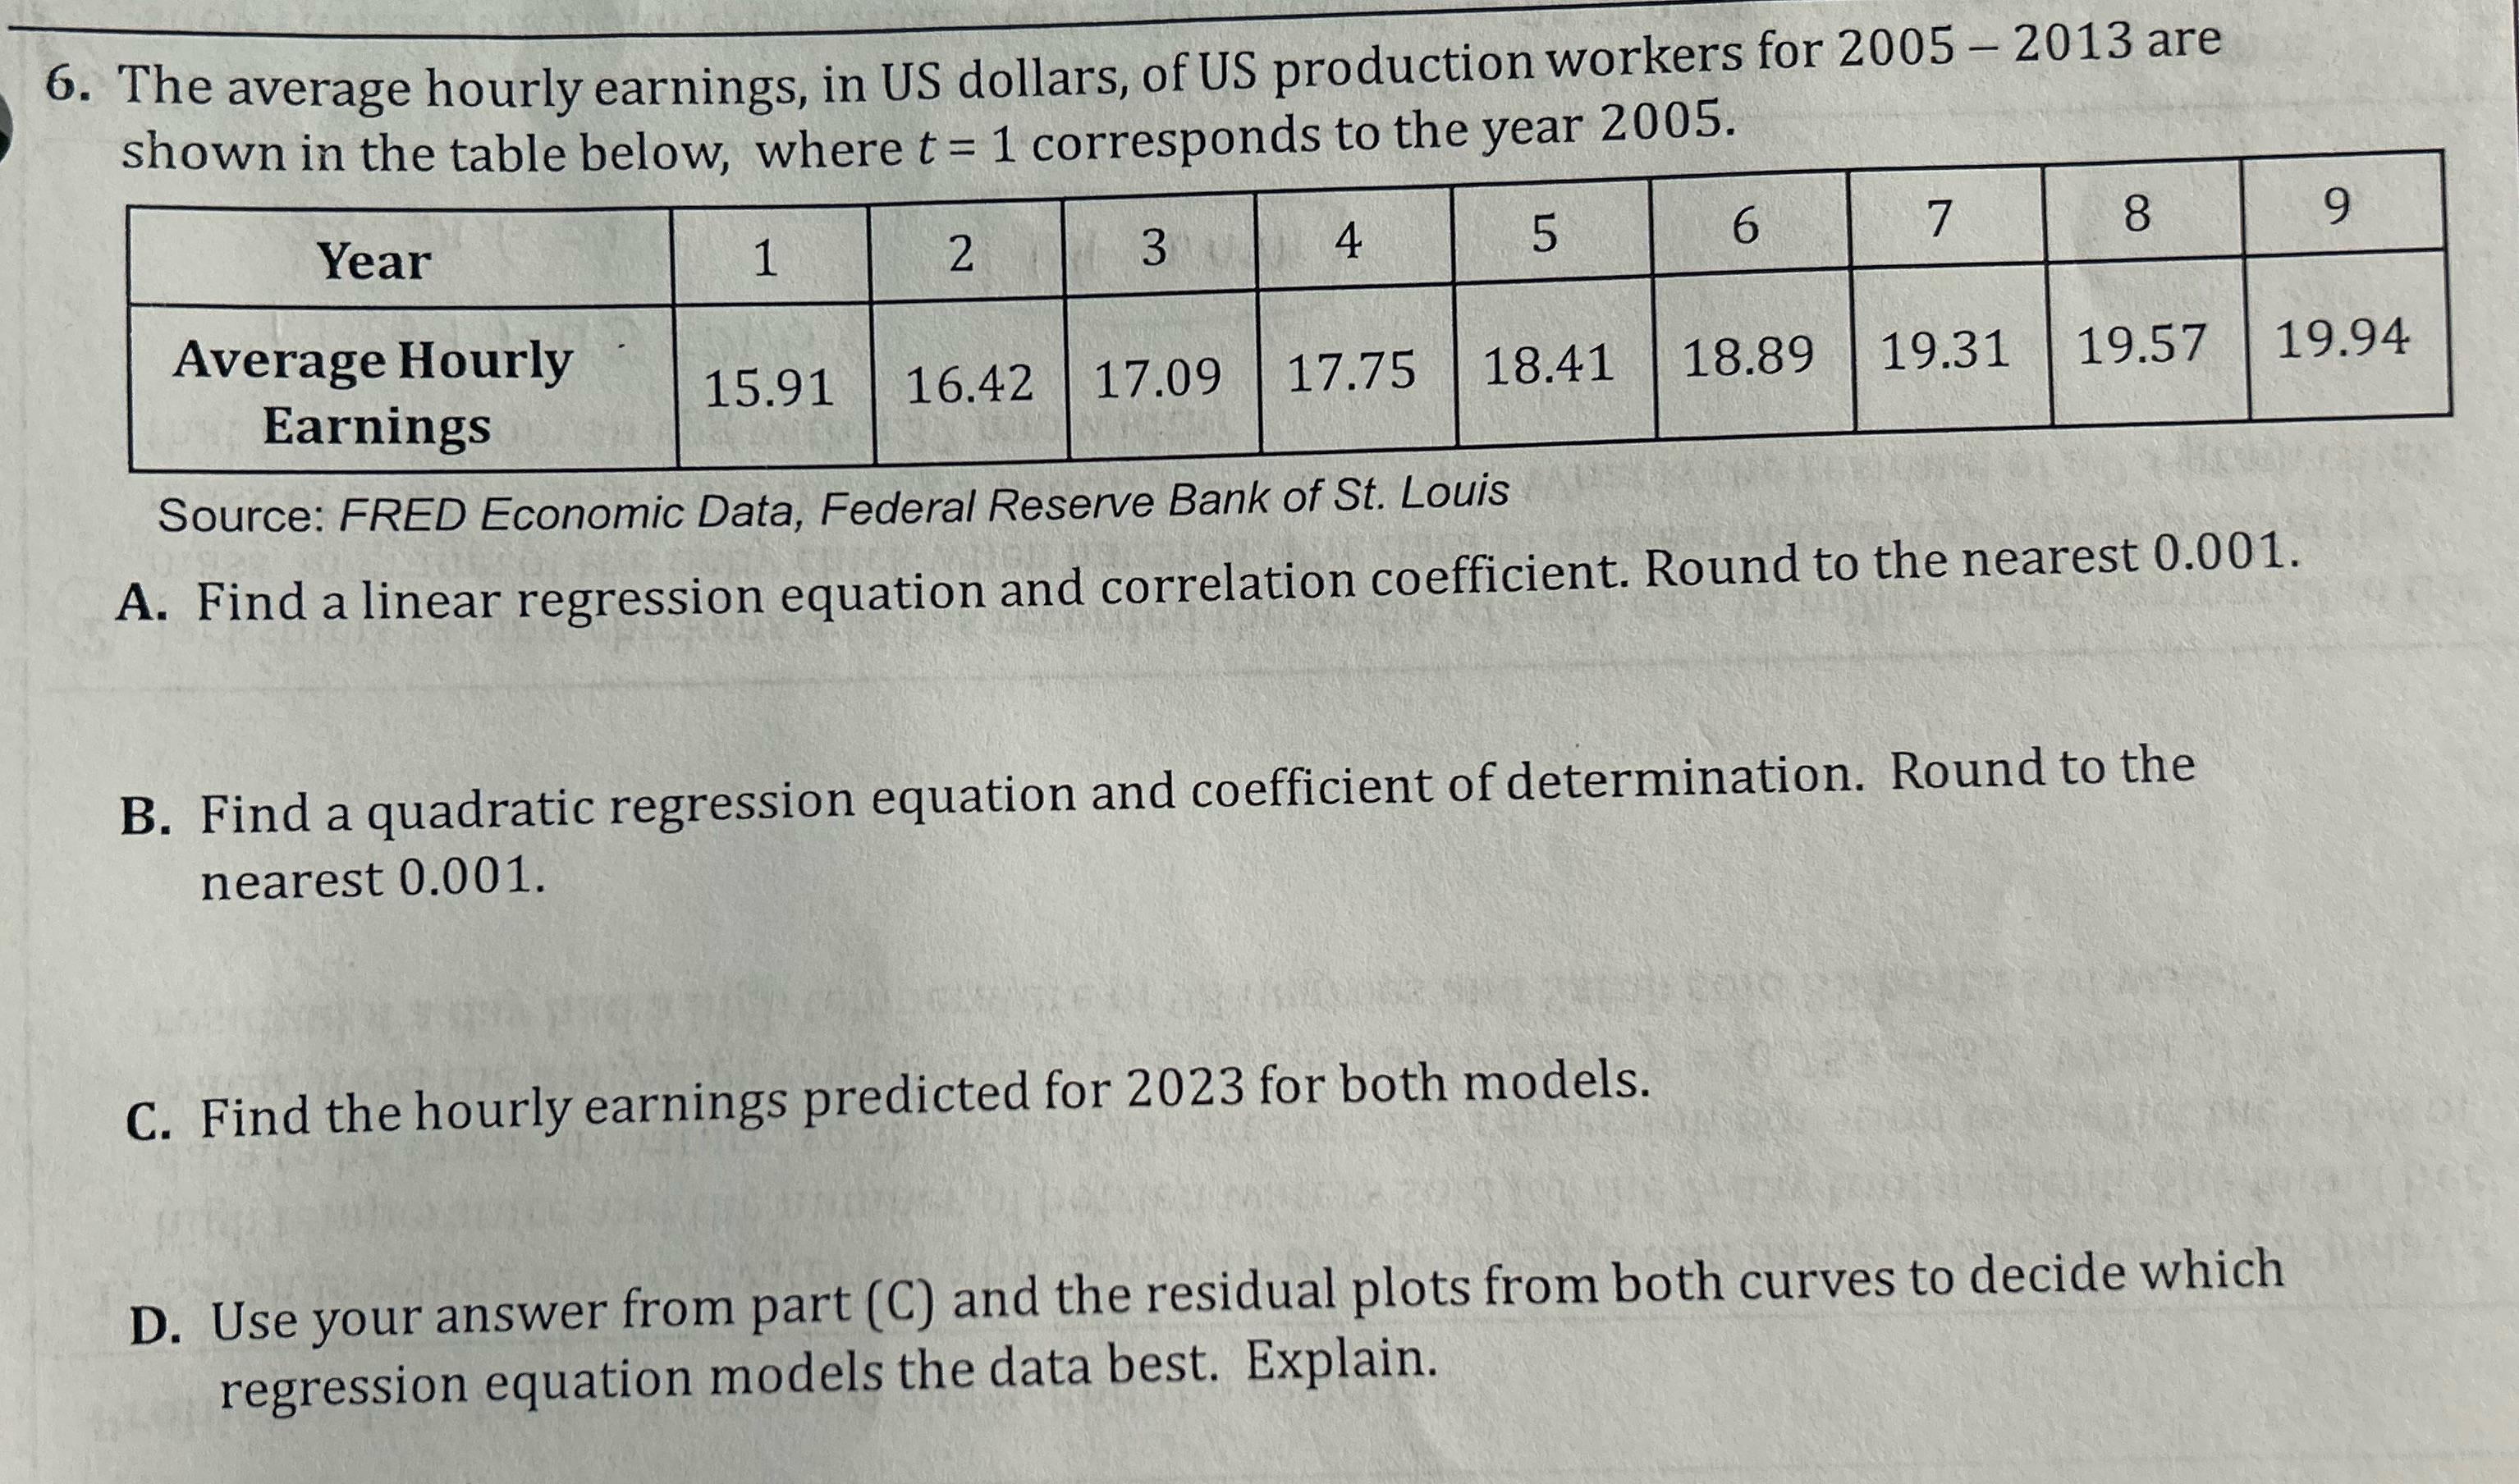
6. The average hourly earnings, in US dollars, of US production workers for 2005 - 2013 are shown in the table below, where t

6. The average hourly earnings, in US dollars, of US production workers for 2005 - 2013 are shown in the table below, where t = 1 corresponds to the year 2005. Year 1 2 3 4 5 6 7 8 9 Average Hourly Earnings 15.91 16.42 17.75 17.09 18.41 18.89 19.31 19.57 19.94 Source: FRED Economic Data, Federal Reserve Bank of St. Louis A. Find a linear regression equation and correlation coefficient. Round to the nearest 0.001. B. Find a quadratic regression equation and coefficient of determination. Round to the nearest 0.001. C. Find the hourly earnings predicted for 2023 for both models. D. Use your answer from part (C) and the residual plots from both curves to decide which regression equation models the data best. Explain.
Step by Step Solution
There are 3 Steps involved in it
Step: 1
A To find the linear regression equation and correlation coefficient we will use a calculator or sta...
Get Instant Access to Expert-Tailored Solutions
See step-by-step solutions with expert insights and AI powered tools for academic success
Step: 2

Step: 3

Ace Your Homework with AI
Get the answers you need in no time with our AI-driven, step-by-step assistance
Get Started


