

Answered step by step
Verified Expert Solution
Question
1 Approved Answer
6) The following graph represents the Profile of Net Present Values (NPV Profile) for Projects A and B. Both projects have the same duration, the
6) The following graph represents the Profile of Net Present Values (NPV Profile) for Projects A and B. Both projects have the same duration, the same initial investment and the cost of capital, r, of both is less than the Cross Over Point . According to the information provided, the capital budget should include: 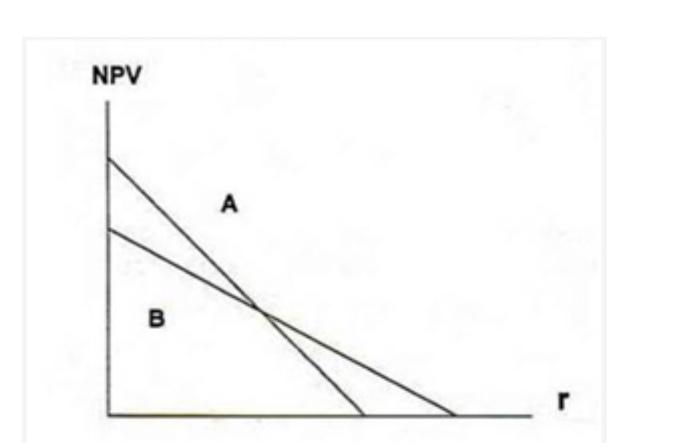
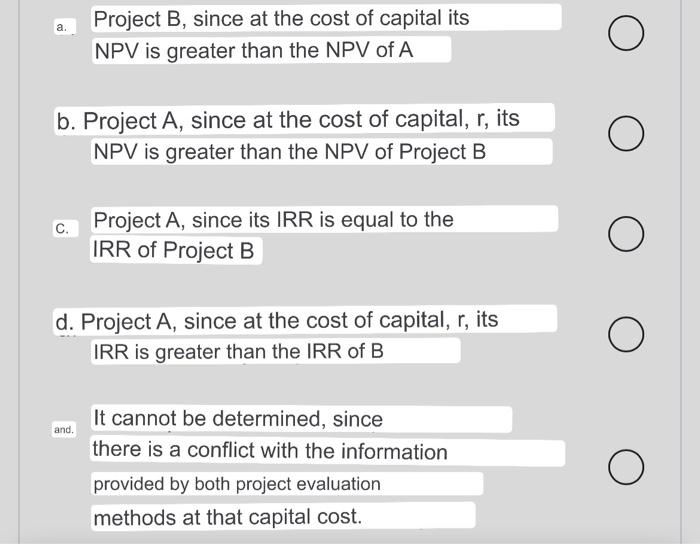
NPV B A Project B, since at the cost of capital its NPV is greater than the NPV of A b. Project A, since at the cost of capital, r, its NPV is greater than the NPV of Project B C. Project A, since its IRR is equal to the IRR of Project B d. Project A, since at the cost of capital, r, its IRR is greater than the IRR of B It cannot be determined, since there is a conflict with the information provided by both project evaluation methods at that capital cost. a. and.. O O O O Step by Step Solution
There are 3 Steps involved in it
Step: 1

Get Instant Access to Expert-Tailored Solutions
See step-by-step solutions with expert insights and AI powered tools for academic success
Step: 2

Step: 3
Ace Your Homework with AI
Get the answers you need in no time with our AI-driven, step-by-step assistance
Get Started
Secured Finance Transactions
Authors: Dominic RM Griffiths
2nd Edition
1787425142, 978-1787425149