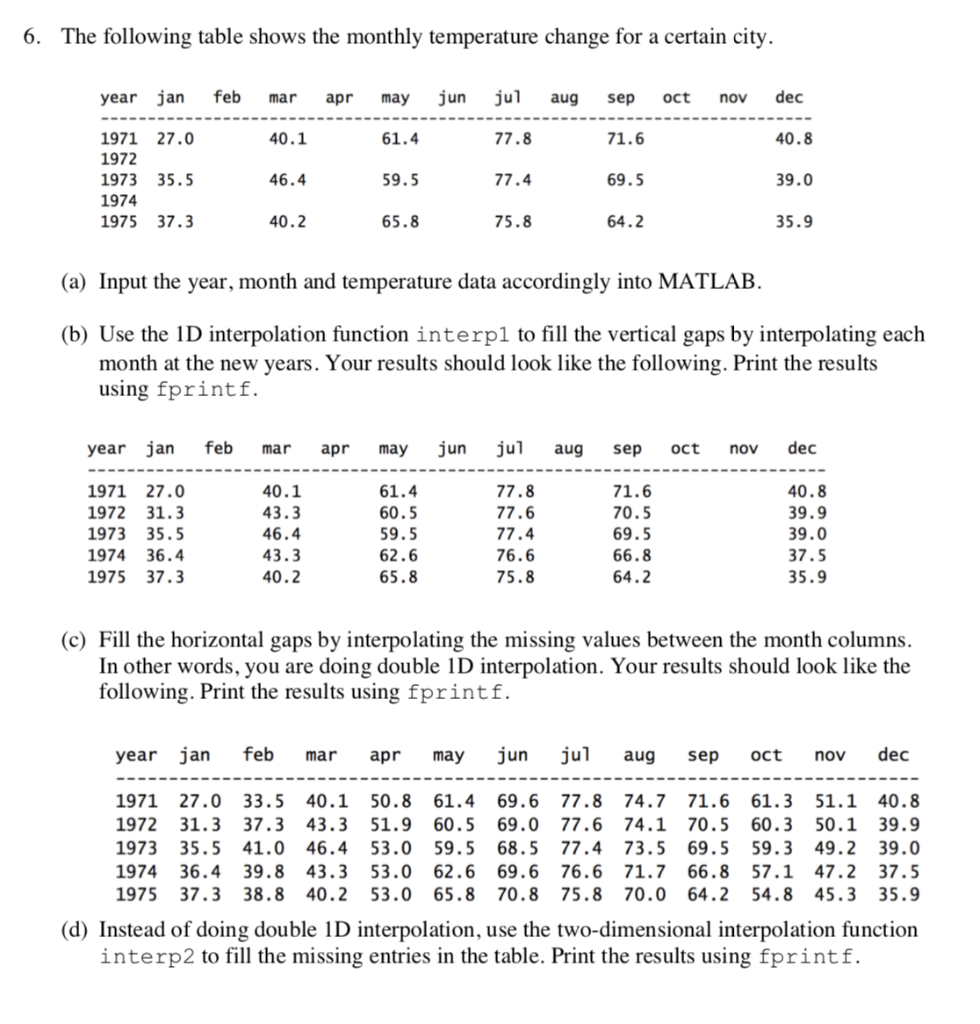
6. The following table shows the monthly temperature change for a certain city. year jan feb mar apr may jun jul aug sep oct nov dec 1971 27.0 1972 1973 35.5 1974 1975 37.3 40.1 46.4 40.2 61.4 59.5 65.8 77.8 77.4 75.8 71.6 69.5 64.2 40.8 39.0 35.9 (a) Input the year, month and temperature data accordingly into MATLAB. (b) Use the 1D interpolation function interpl to fill the vertical gaps by interpolating each month at the new years. Your results should look like the following. Print the results using fprintf. year jan feb mar apr may jun ju aug sep oct nov dec 1971 27.0 1972 31.3 1973 35.5 1974 36.4 1975 37.3 40.1 43.3 46.4 43.3 40.2 61.4 60.5 59.5 62.6 65.8 77.8 77.6 77.4 76.6 75.8 71.6 70.5 69.5 66.8 64.2 40.8 39.9 39.0 37.5 35.9 (c) Fill the horizontal gaps by interpolating the missing values between the month columns In other words, you are doing double 1D interpolation. Your results should look like the following. Print the results using fprintf. year jan feb mar apr may jun ju aug sep oct nov dec 1971 27.0 33.5 40.1 50.8 61.4 69.6 77.8 74.7 71.6 61.3 51.1 40.8 1972 31.3 37.3 43.3 51.9 60.5 69.0 77.6 74.1 70.5 60.3 50.1 39.9 1973 35.5 41.0 46.4 53.0 59.5 68.5 77.4 73.569.5 59.3 49.2 39.0 1974 36.4 39.8 43.3 53.0 62.6 69.6 76.6 71.7 66.8 57.1 47.2 37.5 1975 37.3 38.8 40.2 53.0 65.8 70.8 75.8 70.0 64.2 54.8 45.3 35.9 (d) Instead of doing double 1D interpolation, use the two-dimensional interpolation function interp2 to fill the missing entries in the table. Print the results using fprintf. 6. The following table shows the monthly temperature change for a certain city. year jan feb mar apr may jun jul aug sep oct nov dec 1971 27.0 1972 1973 35.5 1974 1975 37.3 40.1 46.4 40.2 61.4 59.5 65.8 77.8 77.4 75.8 71.6 69.5 64.2 40.8 39.0 35.9 (a) Input the year, month and temperature data accordingly into MATLAB. (b) Use the 1D interpolation function interpl to fill the vertical gaps by interpolating each month at the new years. Your results should look like the following. Print the results using fprintf. year jan feb mar apr may jun ju aug sep oct nov dec 1971 27.0 1972 31.3 1973 35.5 1974 36.4 1975 37.3 40.1 43.3 46.4 43.3 40.2 61.4 60.5 59.5 62.6 65.8 77.8 77.6 77.4 76.6 75.8 71.6 70.5 69.5 66.8 64.2 40.8 39.9 39.0 37.5 35.9 (c) Fill the horizontal gaps by interpolating the missing values between the month columns In other words, you are doing double 1D interpolation. Your results should look like the following. Print the results using fprintf. year jan feb mar apr may jun ju aug sep oct nov dec 1971 27.0 33.5 40.1 50.8 61.4 69.6 77.8 74.7 71.6 61.3 51.1 40.8 1972 31.3 37.3 43.3 51.9 60.5 69.0 77.6 74.1 70.5 60.3 50.1 39.9 1973 35.5 41.0 46.4 53.0 59.5 68.5 77.4 73.569.5 59.3 49.2 39.0 1974 36.4 39.8 43.3 53.0 62.6 69.6 76.6 71.7 66.8 57.1 47.2 37.5 1975 37.3 38.8 40.2 53.0 65.8 70.8 75.8 70.0 64.2 54.8 45.3 35.9 (d) Instead of doing double 1D interpolation, use the two-dimensional interpolation function interp2 to fill the missing entries in the table. Print the results using fprintf