

Answered step by step
Verified Expert Solution
Question
1 Approved Answer
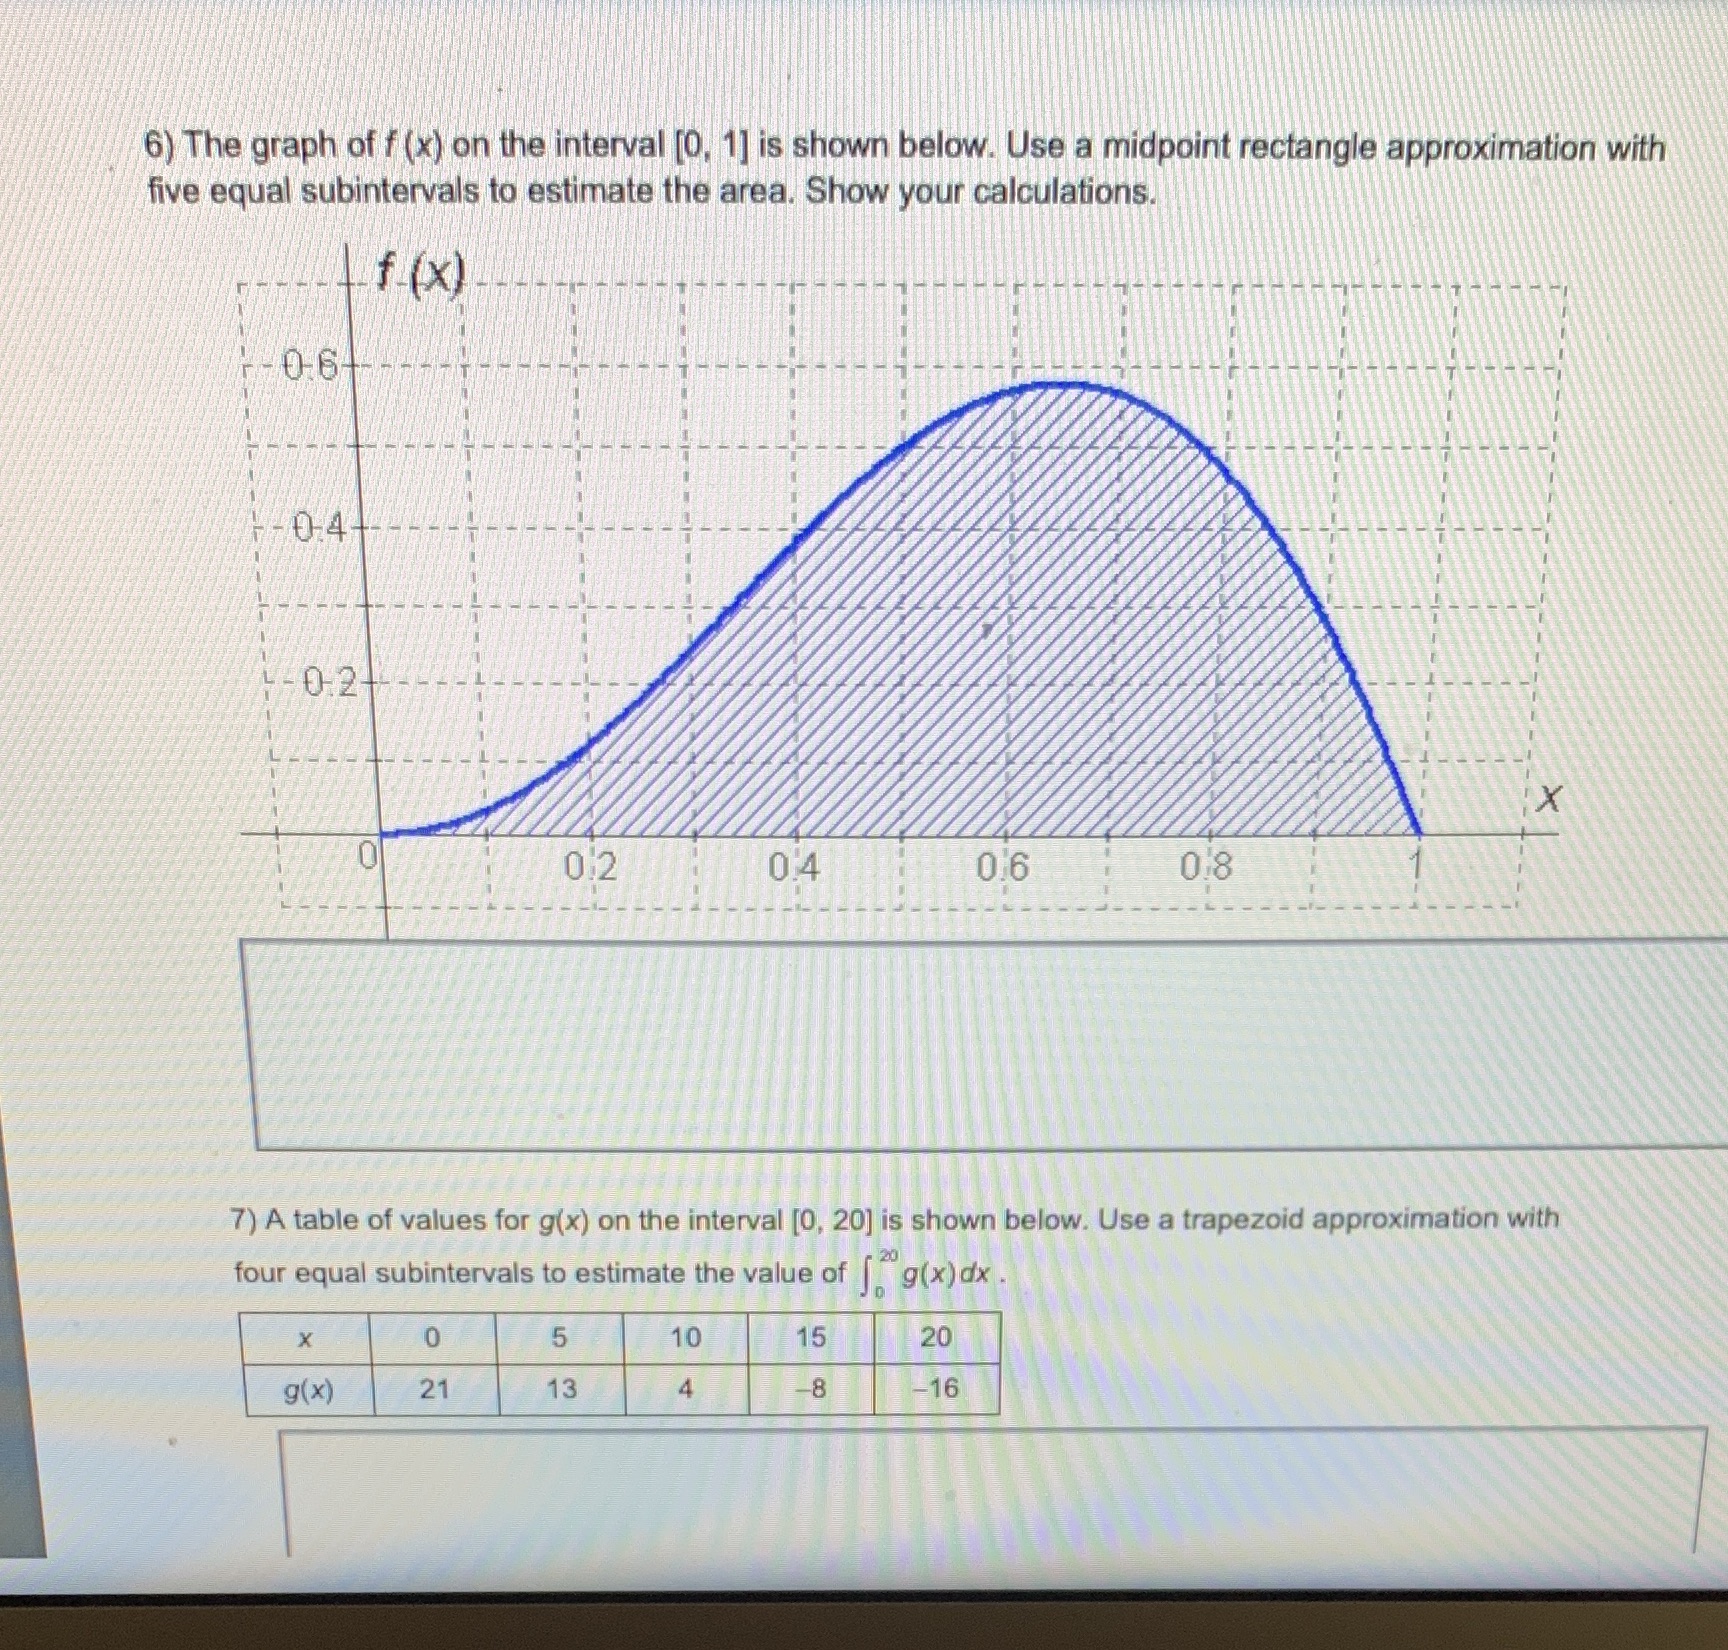
6) The graph of f (x) on the interval [0, 1] is shown below. Use a midpoint rectangle approximation with five equal subintervals to estimate
Step by Step Solution
There are 3 Steps involved in it
Step: 1

Get Instant Access to Expert-Tailored Solutions
See step-by-step solutions with expert insights and AI powered tools for academic success
Step: 2

Step: 3
Ace Your Homework with AI
Get the answers you need in no time with our AI-driven, step-by-step assistance
Get Started
Calculus (Multi Variable)
Authors: Michael Sullivan
1st Edition
1464142890, 9781464142895