Answered step by step
Verified Expert Solution
Link Copied!

Question

1 Approved Answer

6. The scatterplot below displays the relationship between 2 variables. H 12 10 0 a5 1 16 2 25 3 35 If a linear regression

image text in transcribed
6. The scatterplot below displays the relationship between 2 variables. H 12 10 0 a5 1 16 2 25 3 35 If a linear regression was performed, which of the following lines would be most likely the correct line for explaining the relationship pictured above? (you may want to sketch a linear approximation to the data rst) a) y = 4:: +10 b) y=4x+6 c) y=20x10 d) y=4x+1 e) y=10x+10

Step by Step Solution

There are 3 Steps involved in it

Step: 1

blur-text-image

Get Instant Access to Expert-Tailored Solutions

See step-by-step solutions with expert insights and AI powered tools for academic success

Step: 2

blur-text-image

Step: 3

blur-text-image

Ace Your Homework with AI

Get the answers you need in no time with our AI-driven, step-by-step assistance

Get Started

Recommended Textbook for

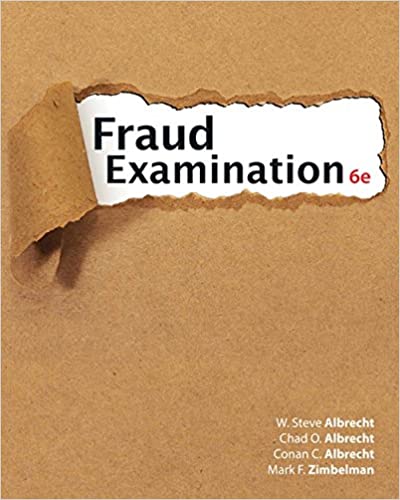
Fraud Examination

Authors: W. Steve Albrecht

6th Edition

1337619671, 978-1337619677

More Books

Students also viewed these Accounting questions

Question

Question 1 (a2) What is the reaction force Dx in [N]?

Answered: 1 week ago