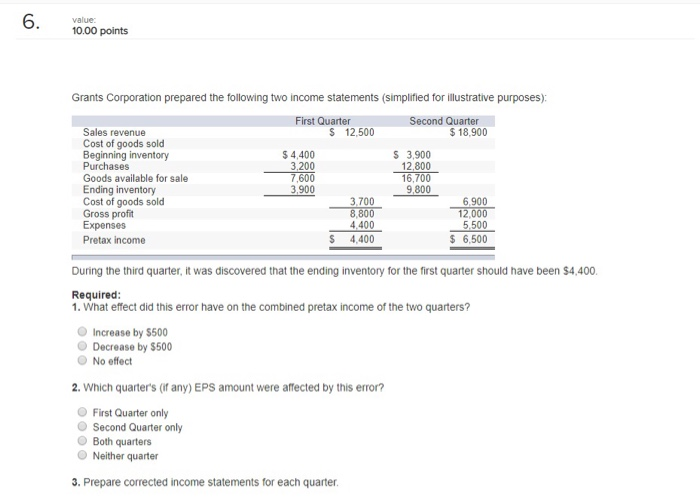
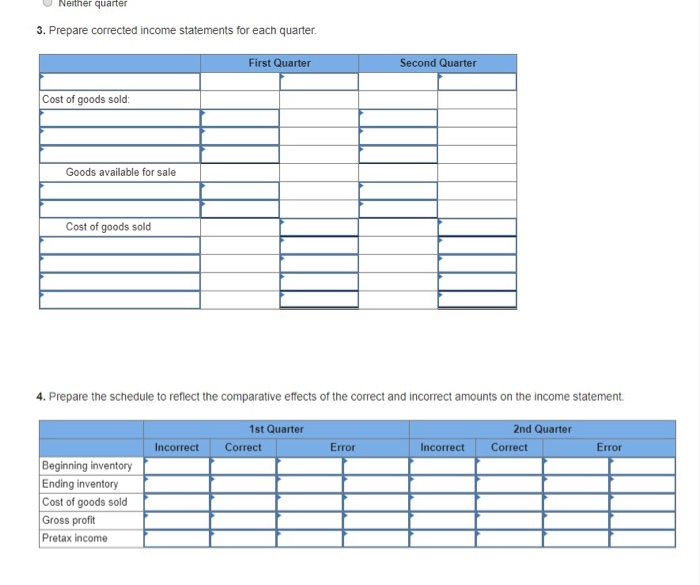
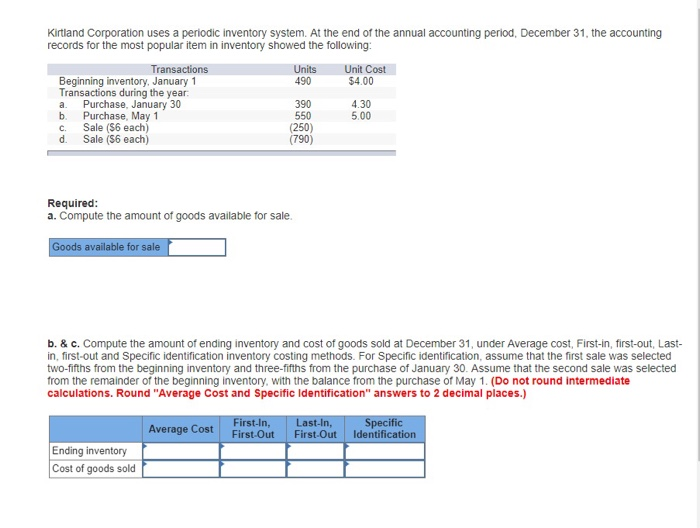
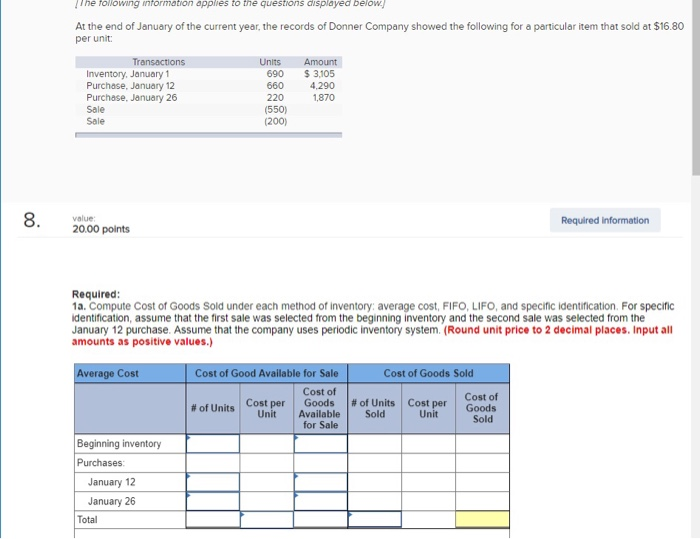
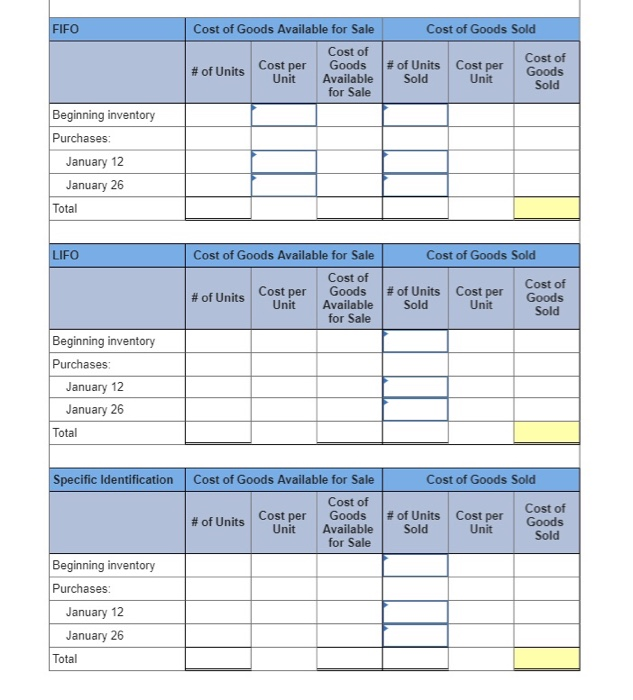
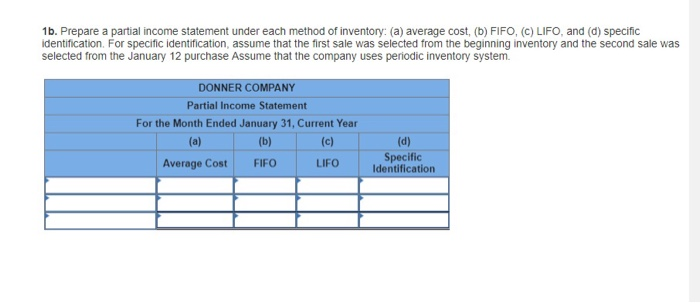
6. value 10.00 points Grants Corporation prepared the following two income statements (simplified for illustrative purposes): First Quarter S 12,500 Second Quarter $18,900 Sales revenue Cost of goods sold Beginning inventory Purchases S 3,900 12.800 $4,400 3.200 7,600 3,900 Goods available for sale Ending inventory Cost of goods sold Gross profit Expenses 16.700 9,800 3.700 8,800 4,400 6,900 12,000 5,500 $ 6,500 Pretax income 4,400 During the third quarter, it was discovered that the ending inventory for the first quarter should have been $4,400. Required: 1. What effect did this error have on the combined pretax income of the two quarters? Increase by $500 Decrease by $500 No effect 2. Which quarter's (if any) EPS amount were affected by this error? First Quarter only Second Quarter only Both quarters Neither quarter 3. Prepare corrected income statements for each quarter Neither quarter 3. Prepare corrected income statements for each quarter First Quarter Second Quarter Cost of goods sold: Goods available for sale Cost of goods sold 4. Prepare the schedule to reflect the comparative effects of the correct and incorrect amounts on the income statement 2nd Quarter 1st Quarter Correct Incorrect Error Incorrect Correct Error Beginning inventory Ending inventory Cost of goods sold Gross profit Pretax income Kirtland Corporation uses a periodic inventory system. At the end of the annual accounting period, December 31, the accounting records for the most popular item in inventory showed the following: Unit Cost $4,00 Transactions Units 490 Beginning inventory, January 1 Transactions during the year Purchase, January 30 Purchase, May 1 Sale ($6 each) 390 550 (250) (790) 4.30 5.00 a. h C. d. Sale ($6 each) Required: a. Compute the amount of goods available for sale. Goods available for sale b. & c. Compute the amount of ending inventory and cost of goods sold at December 31, under Average cost, First-in, first-out, Last- in, first-out and Specific identification inventory costing methods. For Specific identification, assume that the first sale was selected two-fifths from the beginning inventory and three-fifths from the purchase of January 30. Assume that the second sale was selected from the remainder of the beginning inventory, with the balance from the purchase of May 1. (Do not round intermediate calculations. Round "Average Cost and Specific lIdentification" answers to 2 decimal places.) Specific First-In, First-Out Last-In, First-Out Identification Average Cost Ending inventory Cost of goods sold The following information applies to the questions displayed below At the end of January of the current year, the records of Donner Company showed the following for a particular item that sold at $16.80 per unit Transactions Inventory, January 1 Purchase, January 12 Purchase, January 26 Units Amount $ 3,105 690 660 4.290 220 1,870 Sale (550) (200) Sale 8. value: 20.00 points Required information Required: 1a. Compute Cost of Goods Sold under each method of inventory: average cost, FIFO, LIFO, and specific identification. For specific identification, assume that the first sale was selected from the beginning inventory and the second sale was selected from the January 12 purchase. Assume that the company uses periodic inventory system. (Round unit price to 2 decimal places. Input all amounts as positive values.) Average Cost Cost of Good Available for Sale Cost of Goods Sold Cost of Goods Available for Sale Cost of Goods Sold Cost per Unit Cost per Unit # of Units Sold # of Units Beginning inventory Purchases: January 12 January 26 Total FIFO Cost of Goods Available for Sale Cost of Goods Sold Cost of Cost of Goods Sold Cost per Unit # of Units Cost per Unit Goods Available for Sale #of Units Sold Beginning inventory Purchases: January 12 January 26 Total LIFO Cost of Goods Available for Sale Cost of Goods Sold Cost of Cost of Goods Cost per Unit Goods Available for Sale #of Units Sold Cost per Unit #of Units Sold Beginning inventory Purchases: January 12 January 26 Total Specific Identification Cost of Goods Available for Sale Cost of Goods Sold Cost of Goods Available Cost of Goods Cost per Unit Cost per Unit # of Units #of Units Sold Sold for Sale Beginning inventory Purchases January 12 January 26 Total 1b. Prepare a partial income statement under each method of inventory: (a) average cost, (b) FIFO, (c) LIFO, and (d) specific identification. For specific identification, assume that the first sale was selected from the beginning inventory and the second sale was selected from the January 12 purchase Assume that the company uses periodic inventory system DONNER COMPANY Partial Income Statement For the Month Ended January 31, Current Year (a) (b) (c) (d) Specific Identification Average Cost FIFO LIFO
