

Answered step by step
Verified Expert Solution
Question
1 Approved Answer
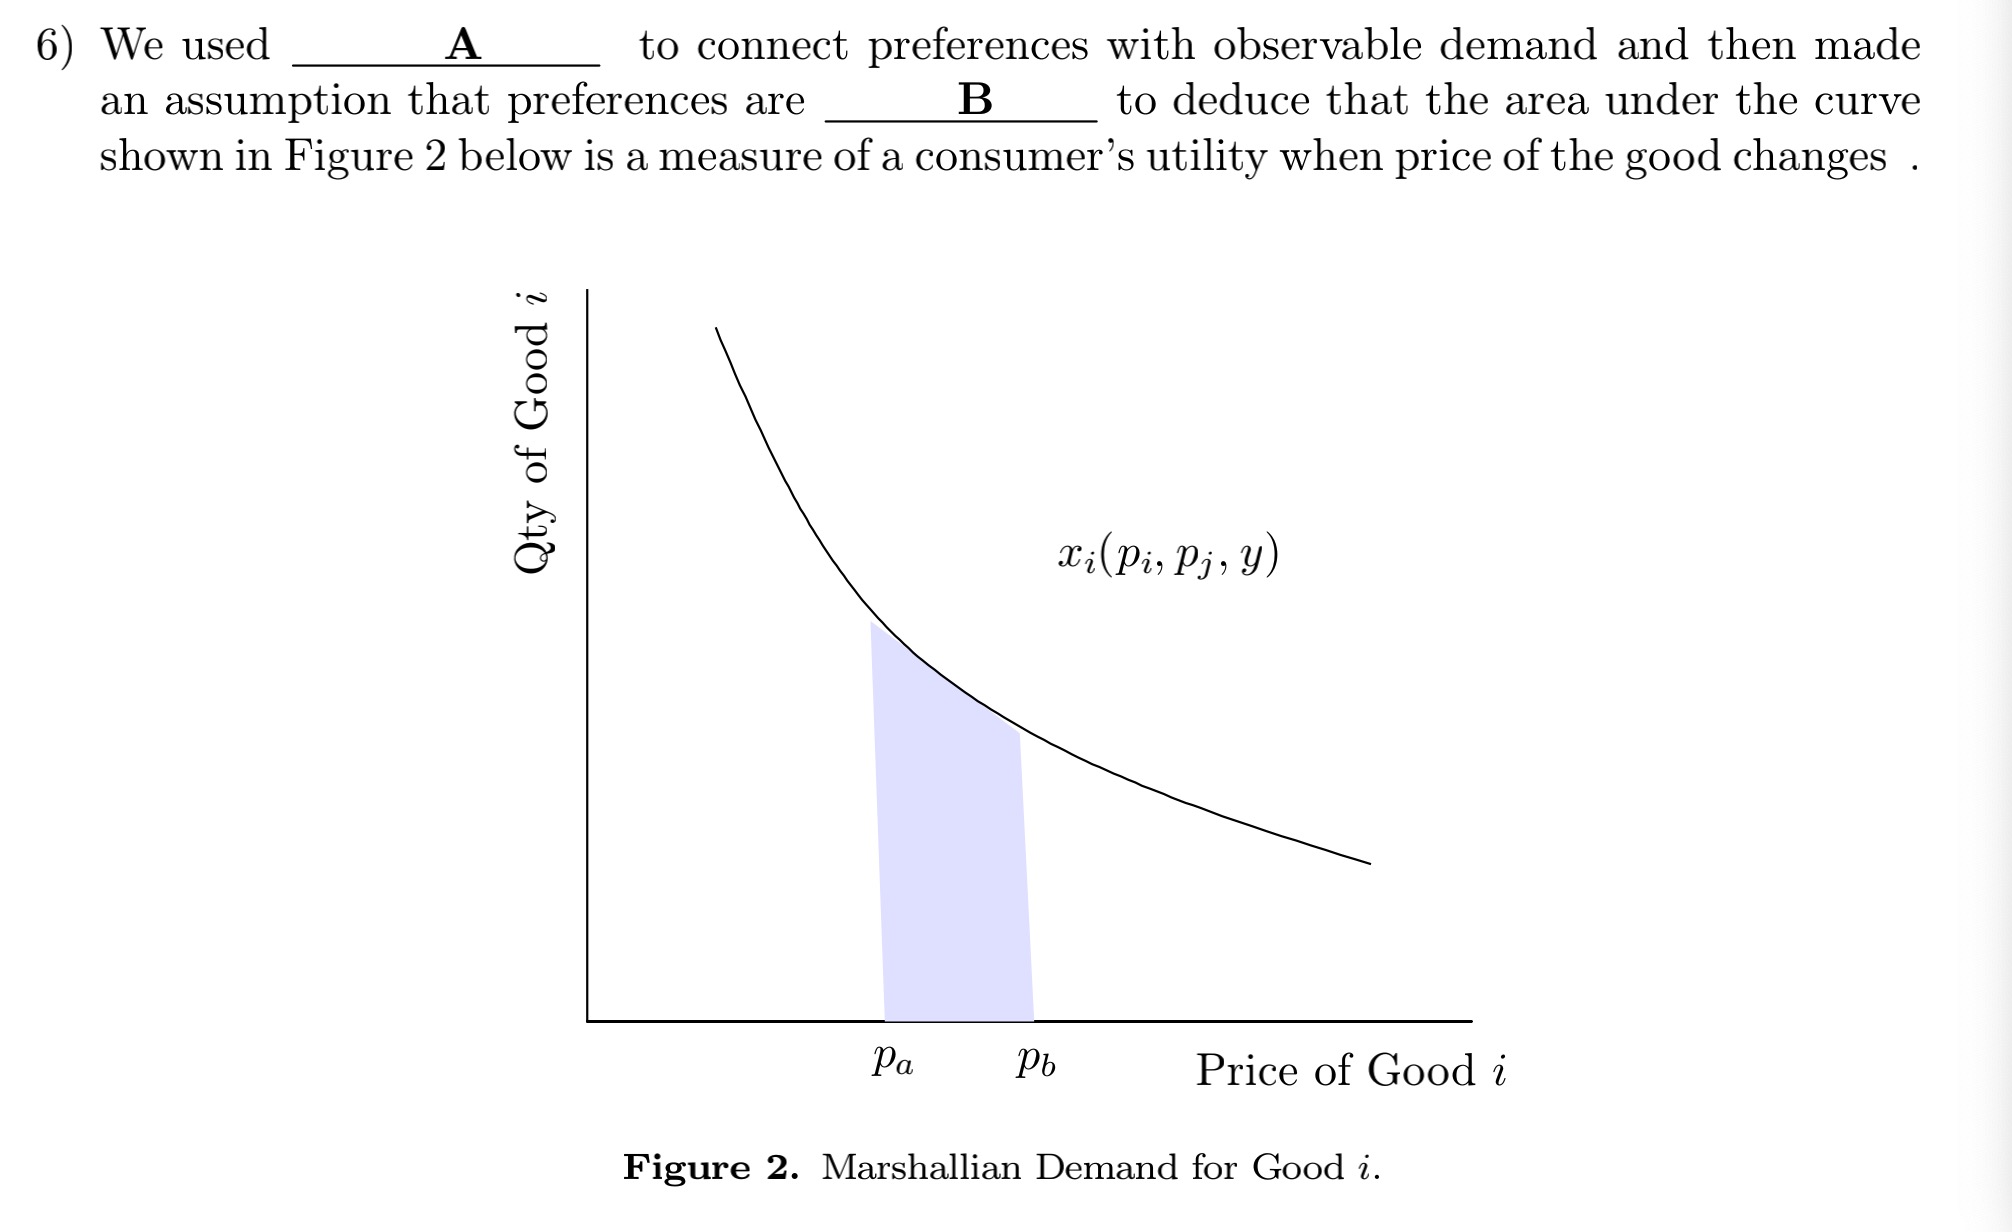
6) We used A to connect preferences with observable demand and then made an assumption that preferences are B to deduce that the area under
Step by Step Solution
There are 3 Steps involved in it
Step: 1

Get Instant Access to Expert-Tailored Solutions
See step-by-step solutions with expert insights and AI powered tools for academic success
Step: 2

Step: 3
Ace Your Homework with AI
Get the answers you need in no time with our AI-driven, step-by-step assistance
Get Started
The Economic Consequences Of The Peace
Authors: John Maynard Keynes
1st Edition
1420905856, 9781420905854