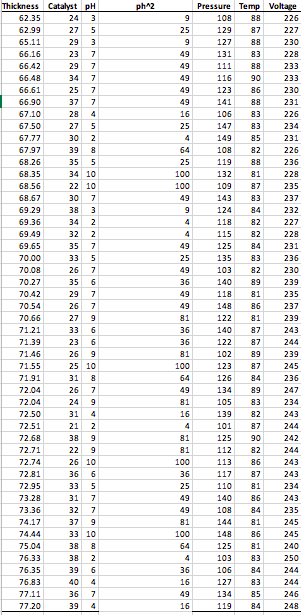
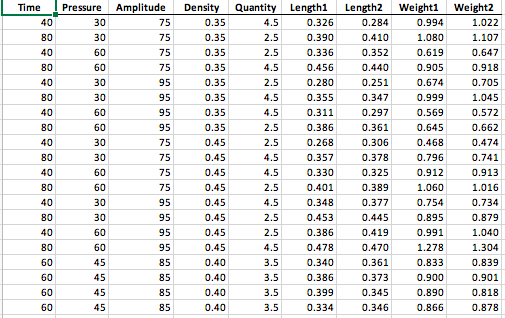
602 CHAPTER 15 Multiple Regression Model Building PH-PH level of the acid bath 15.37 Financial analysts engage in business valuation to Pressure-Pressure in the tank holding the acid bath determine a company's value. A standard approach uses Temp-Temperature in the tank holding the acid bath the multiple of earnings method: You multiply a company's Voltage-Voltage applied to the tank holding the acid bath profits by a certain value (average or median) to arrive at a final value. More recently, regression analysis has been Develop the most appropriate multiple regression model to demonstrated to consistently deliver more accurate predict predict the thickness of the alloy layer. Be sure to perform a tions. A valuator has been given the assignment of valuing thorough residual analysis. The article suggests that there is a drug company. She obtained financial data on 71 drug a significant interaction between the pressure and the tem- companies (Industry Group Standard Industrial Classifi- perature in the tank. Do you agree? cation [SIC] 3 code 283), which included pharmaceutical preparation firms (SIC 4 code 2834), in vitro and in vivo 15.39 A molding machine that contains different cavi- diagnostic substances firms (SIC 4 code 2835), and biologic ties is used in producing plastic parts. The product char- cal products firms (SIC 4 2836). The file Business Valuation2 acteristics of interest are the product length (in.) and contains the following variables: weight (g). The mold cavities were filled with raw mate- COMPANY-Drug company name rial powder and then vibrated during the experiment. The TS-Ticker symbol factors that were varied were the vibration time (seconds), SIC 3-Standard Industrial Classification 3 code (indus- the vibration pressure (psi), the vibration amplitude (%), try group identifier) the raw material density (g/mL), and the quantity of raw SIC 4-Standard Industrial Classification 4 code (indus- material (scoops). The experiment was conducted in two try identifier) different cavities on the molding machine. The data are PB fye-Price-to-book value ratio (fiscal year ending) stored in Molding . (Data extracted from M. Lopez and PE fye-Price-to-earnings ratio (fiscal year ending) M. McShane-Vaughn, "Maximizing Product, Minimiz NL Assets-Natural log of assets (as a measure of size) ing Costs," Six Sigma Forum Magazine, February 2008, ROE-Return on equity pp. 18-23.) SGROWTH-Growth (GS5) a. Develop the most appropriate multiple regression model DEBT/EBITDA-Ratio of debt to earnings before inter- to predict the product length in cavity 1. Be sure to per- est, taxes, depreciation, and amortization form a thorough residual analysis. In addition, provide a D2834-Dummy variable indicator of SIC 4 code 2834 detailed explanation of your results. (1 if 2834, 0 if not) b. Repeat (a) for cavity 2. D2835-Dummy variable indicator of SIC 4 code 2835 c. Compare the results for length in the two cavities. (1 if 2835, 0 if not) d. Develop the most appropriate multiple regression model Develop the most appropriate multiple regression model to to predict the product weight in cavity 1. Be sure to per- predict the price-to-book value ratio. Be sure to perform a form a thorough residual analysis. In addition, provide a thorough residual analysis. In addition, provide a detailed detailed explanation of your results. explanation of your results. e. Repeat (d) for cavity 2. f. Compare the results for weight in the two cavities. 15.38 A recent article (J. Conklin, "It's a Marathon, Not a Sprint," Quality Progress, June 2009, pp. 46-49) dis- REPORT WRITING EXERCISE cussed a metal deposition process in which a piece of metal is placed in an acid bath and an alloy is layered on top of it. 15.40 In Problem 15.23 on page 594, you developed The key quality characteristic is the thickness of the alloy a multiple regression model to predict monthly sales at layer. The file Thickness contains the following variables: sporting goods stores for the data stored in Sporting . Now Thickness-Thickness of the alloy layer write a report based on the model you developed. Append Catalyst-Catalyst concentration in the acid bath report. all appropriate charts and statistical information to yourThickness Catalyst PH ph42 Pressure Temp Voltage 62.35 24 3 9 108 88 226 62.99 27 5 25 129 87 227 65.11 29 3 9 127 88 230 66.16 23 49 131 83 228 56.42 29 49 111 88 233 66.48 34 7 49 116 90 233 66.61 25 49 123 86 230 66.90 37 49 141 88 231 67.10 28 16 106 83 226 67.50 27 5 25 147 234 67.77 30 2 4 149 85 231 67.97 39 64 108 82 226 68.26 35 5 25 119 88 236 68.35 34 10 100 132 81 228 68.56 22 10 100 109 87 235 68.67 30 7 49 143 83 237 69.29 38 3 9 124 84 232 69.36 34 2 118 82 227 69.49 32 2 115 82 228 69.65 35 49 125 84 231 70.00 33 5 25 135 83 236 70.08 26 49 103 82 230 70.27 35 6 36 140 89 239 70.42 29 49 118 81 235 70.54 26 49 148 36 237 70.66 27 9 81 122 81 239 71.21 33 6 36 140 87 243 71.39 23 36 122 87 244 71.46 26 9 81 102 89 239 71.55 25 10 100 123 87 245 71.91 31 64 126 84 236 72.04 26 49 134 89 247 72.04 24 9 81 105 83 234 72.50 31 16 139 82 243 72.51 21 2 4 101 87 244 72.68 38 9 81 125 90 242 72.71 27 9 81 112 244 72.74 26 10 100 113 86 243 72.81 36 6 36 117 87 243 72.95 33 5 25 110 81 234 73.28 31 7 49 140 86 243 73.36 32 7 49 108 84 235 74.17 37 9 81 144 81 245 74.44 33 10 100 148 86 245 75.04 38 64 125 81 240 76.33 38 2 103 83 250 76.35 39 36 106 84 244 76.83 40 1 16 127 83 244 77.11 36 49 134 85 246 77.20 39 4 16 119 34 248Time Pressure Amplitude Density Quantity Length1 Length2 Weight1 Weight2 40 30 75 0.35 4.5 0.326 0.284 0.994 1.022 80 30 75 0.35 2.5 0.390 0.410 1.080 1.107 40 60 75 0.35 2.5 0.336 0.352 0.619 0.647 80 60 75 0.35 4.5 0.456 0.440 0.905 0.918 40 30 95 0.35 2.5 0.280 0.251 0.674 0.705 80 30 95 0.35 4.5 0.355 0.347 0.999 1.045 40 60 95 0.35 4.5 0.311 0.297 0.569 0.572 80 60 95 0.35 2.5 0.386 0.361 0.645 0.662 40 30 75 0.45 2.5 0.268 0.306 0.468 0.474 80 30 75 0.45 4.5 0.357 0.378 0.796 0.741 40 60 75 0.45 4.5 0.330 0.325 0.912 0.913 80 60 75 0.45 2.5 0.401 0.389 1.060 1.016 40 30 95 0.45 4.5 0.348 0.377 0.754 0.734 80 30 95 0.45 2.5 0.453 0.445 0.895 0.879 40 60 95 0.45 2.5 0.386 0.419 0.991 1.040 80 60 95 0.45 4.5 0.478 0.470 1.278 1.304 60 45 85 0.40 3.5 0.340 0.361 0.833 0.839 60 45 85 0.40 3.5 0.386 0.373 006'0 0.901 60 45 85 0.40 3.5 0.399 0.345 0.890 0.818 60 45 85 0.40 3.5 0.334 0.346 0.866 0.878