

Answered step by step
Verified Expert Solution
Question
1 Approved Answer
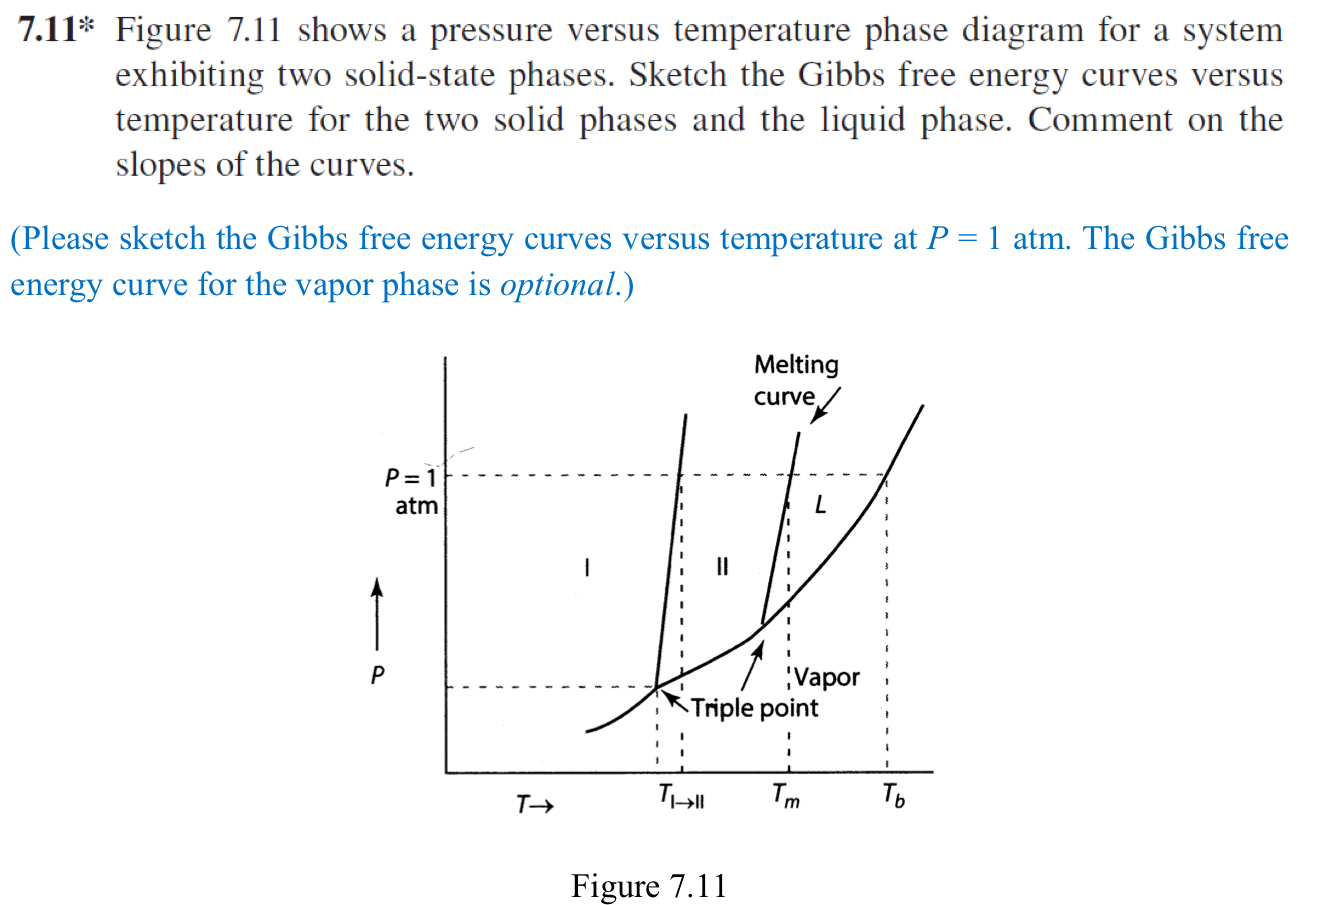
7 . 1 1 * Figure 7 . 1 1 shows a pressure versus temperature phase diagram for a system exhibiting two solid - state
Figure shows a pressure versus temperature phase diagram for a system exhibiting two solidstate phases. Sketch the Gibbs free energy curves versus temperature for the two solid phases and the liquid phase. Comment on the slopes of the curves.
Please sketch the Gibbs free energy curves versus temperature at atm. The Gibbs free energy curve for the vapor phase is optional.
Figure
Step by Step Solution
There are 3 Steps involved in it
Step: 1

Get Instant Access to Expert-Tailored Solutions
See step-by-step solutions with expert insights and AI powered tools for academic success
Step: 2

Step: 3
Ace Your Homework with AI
Get the answers you need in no time with our AI-driven, step-by-step assistance
Get Started
Elementary Principles of Chemical Processes
Authors: Richard M. Felder, Ronald W. Rousseau, Lisa G. Bullard
4th edition
978-1118431221, 9781119192138, 1118431227, 1119192137, 978-1119498759