

Answered step by step
Verified Expert Solution
Question
1 Approved Answer
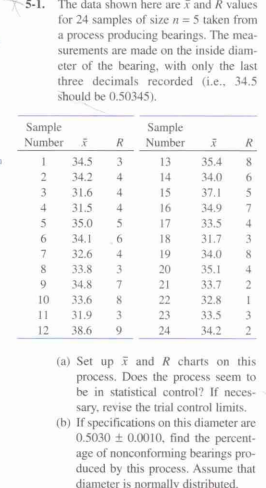
7 5-1. The data shown here are x and R values for 24 samples of size n = 5 taken from a process producing bearings.
Step by Step Solution
There are 3 Steps involved in it
Step: 1

Get Instant Access to Expert-Tailored Solutions
See step-by-step solutions with expert insights and AI powered tools for academic success
Step: 2

Step: 3
Ace Your Homework with AI
Get the answers you need in no time with our AI-driven, step-by-step assistance
Get Started
Linear Algebra and Its Applications
Authors: Gilbert Strang
4th edition
30105678, 30105676, 978-0030105678