Question
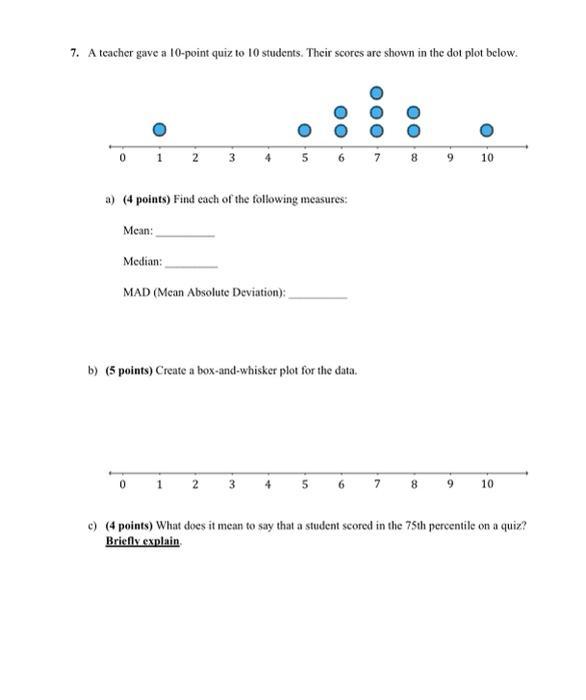
7. A teacher gave a 10-point quiz to 10 students. Their scores are shown in the dot plot below. 2 3 5 6 7

7. A teacher gave a 10-point quiz to 10 students. Their scores are shown in the dot plot below. 2 3 5 6 7 8 9 10 a) (4 points) Find each of the following measures: Mean: Median: MAD (Mean Absolute Deviation): b) (5 points) Create a box-and-whisker plot for the data. 0 2 6 7 8 9 10 c) (4 points) What does it mean to say that a student scored in the 75th percentile on a quiz? Briefly explain
Step by Step Solution
There are 3 Steps involved in it
Step: 1
To calculate the MAD we need to find the deviation of each score from the mean take the a...
Get Instant Access to Expert-Tailored Solutions
See step-by-step solutions with expert insights and AI powered tools for academic success
Step: 2

Step: 3

Ace Your Homework with AI
Get the answers you need in no time with our AI-driven, step-by-step assistance
Get StartedRecommended Textbook for
Statistics
Authors: James T. McClave
13th Edition
978-0134080611, 134080610, 134080211, 978-0134080215
Students also viewed these Mathematics questions
Question
Answered: 1 week ago
Question
Answered: 1 week ago
Question
Answered: 1 week ago
Question
Answered: 1 week ago
Question
Answered: 1 week ago
Question
Answered: 1 week ago
Question
Answered: 1 week ago
Question
Answered: 1 week ago
Question
Answered: 1 week ago
Question
Answered: 1 week ago
Question
Answered: 1 week ago
Question
Answered: 1 week ago
Question
Answered: 1 week ago
Question
Answered: 1 week ago
Question
Answered: 1 week ago
Question
Answered: 1 week ago
Question
Answered: 1 week ago
Question
Answered: 1 week ago
Question
Answered: 1 week ago
Question
Answered: 1 week ago
Question
Answered: 1 week ago
Question
Answered: 1 week ago
View Answer in SolutionInn App


