Answered step by step
Verified Expert Solution
Link Copied!

Question

1 Approved Answer

7 According to Ward's Communication, 19% of sports car enthusiasts prefer a red car, 16% silver, 15% black, 14% green, 14% white, and 22% other
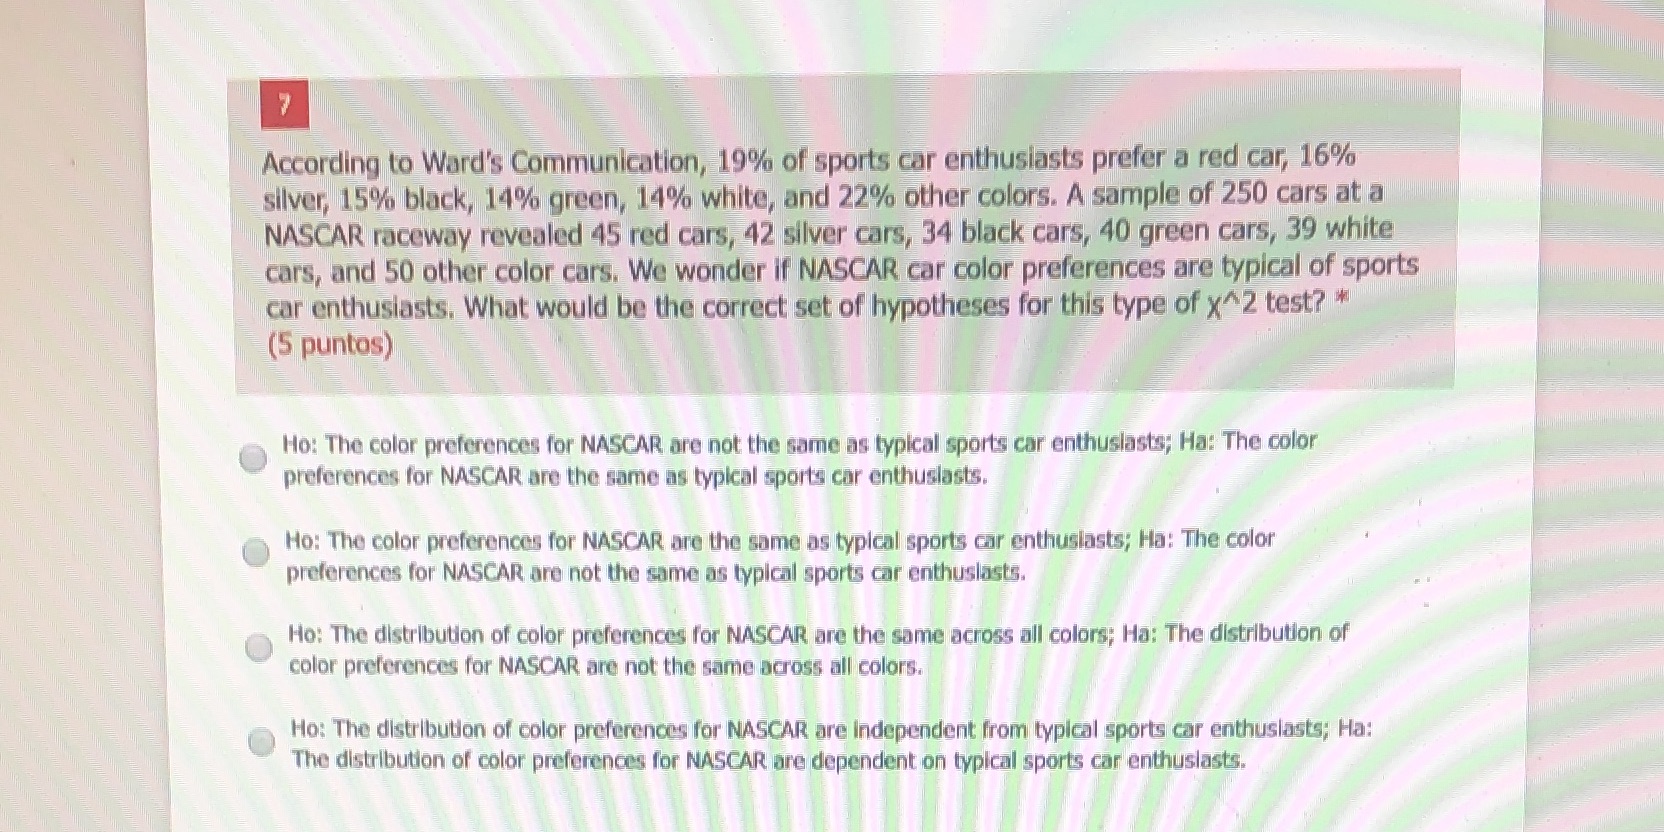
image text in transcribed
7 According to Ward's Communication, 19% of sports car enthusiasts prefer a red car, 16% silver, 15% black, 14% green, 14% white, and 22% other colors. A sample of 250 cars at a NASCAR raceway revealed 45 red cars, 42 silver cars, 34 black cars, 40 green cars, 39 white cars, and 50 other color cars. We wonder if NASCAR car color preferences are typical of sports car enthusiasts. What would be the correct set of hypotheses for this type of x^2 test? * (5 puntos) Ho: The color preferences for NASCAR are not the same as typical sports car enthusiasts; Ha: The color preferences for NASCAR are the same as typical sports car enthusiasts. Ho: The color preferences for NASCAR are the same as typical sports car enthusiasts; Ha: The color preferences for NASCAR are not the same as typical sports car enthusiasts. Ho: The distribution of color preferences for NASCAR are the same across all colors; Ha: The distribution of color preferences for NASCAR are not the same across all colors. Ho: The distribution of color preferences for NASCAR are Independent from typical sports car enthusiasts; Ha: The distribution of color preferences for NASCAR are dependent on typical sports car enthusiasts

Step by Step Solution

There are 3 Steps involved in it

Step: 1

blur-text-image

Get Instant Access to Expert-Tailored Solutions

See step-by-step solutions with expert insights and AI powered tools for academic success

Step: 2

blur-text-image

Step: 3

blur-text-image

Ace Your Homework with AI

Get the answers you need in no time with our AI-driven, step-by-step assistance

Get Started

Recommended Textbook for

Trigonometry, Enhanced

Authors: Cynthia Y Young

4th Edition

1119321131, 9781119321132

More Books

Students also viewed these Mathematics questions