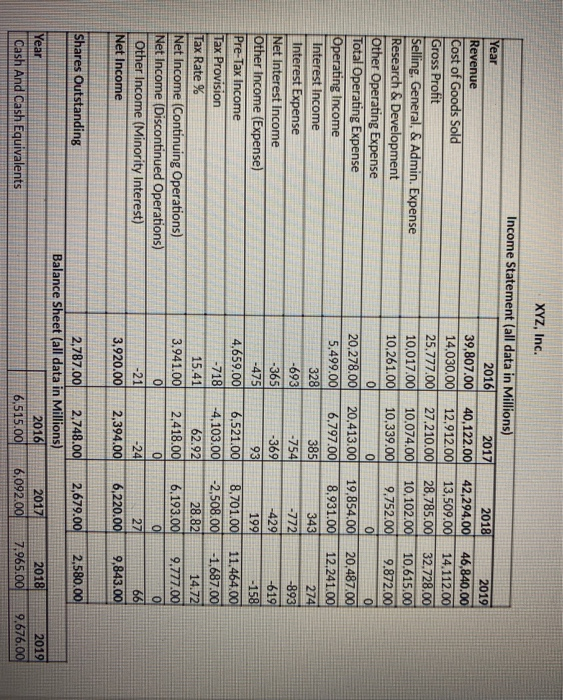
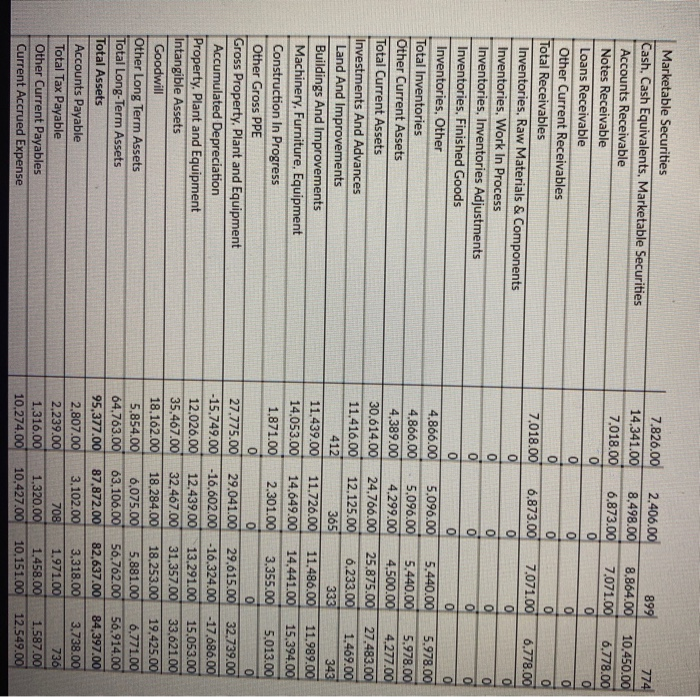
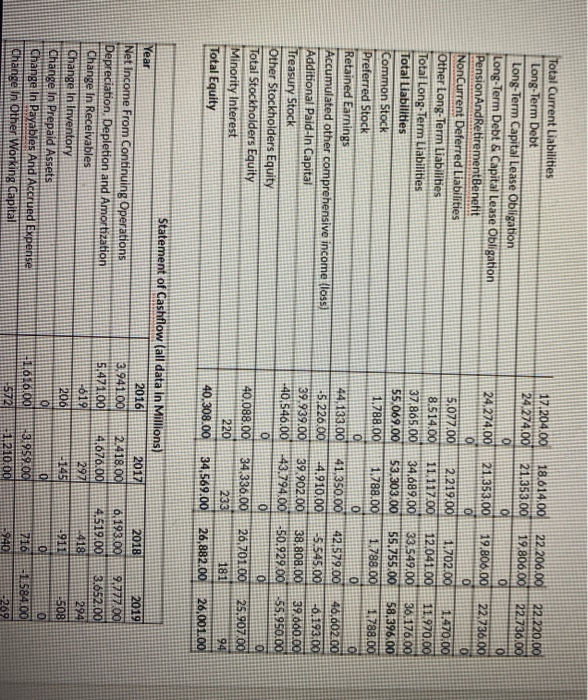
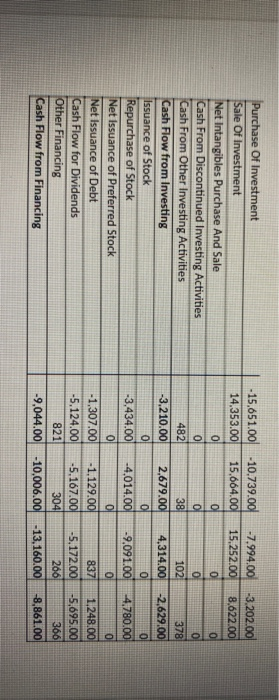
7. If the EV/EBITDA multiple of XYZ Firm is 15 and the EV/EBITDA multiple of your competitor firm is 10, what does that tell investors? 8. If XYZ company paid a dividend of $2.44 per share, and the cost of equity was 10% and the constant growth rate was 2%, how would you value this company? Based on the financials above, could this company afford to pay the dividend? XYZ, Inc. Income Statement (all data in Millions) Year 2016 2017 2018 2019 Revenue 39,807.00 40,122.00 42,294.00 46,840.00 Cost of Goods Sold 14,030.00 12,912.00 13,509.00 14.112.00 Gross Profit 25.777.00 27.210.00 28.785.00 32.728.00 Selling, General, & Admin. Expense 10.017.00 10.074.00 10.102.00 10.615.00 Research & Development 10,261.00 10,339.00 9,752.00 9.872.00 Other Operating Expense ol 0 o 0 Total Operating Expense 20.278.00 20.413.00 19,854.00 20,487.00 Operating Income 5,499.00 6,797.00 8,931.00 12,241.00 Interest Income 328 3851 343 274 Interest Expense -693 -754 -7721 -893) Net Interest Income -365 -369 -429 -619 Other Income (Expense) -475 93 1991 Pre-Tax Income 4,659.00 6,521.00 8,701.00 11.464.00 Tax Provision -718 -4,103.00 -2,508.00 -1.687.00 Tax Rate % 15.41 62.92 28.82 14.72 Net Income (Continuing Operations) 3.941.00 2.418.00 6.193.00 9.777.00 Net Income (Discontinued Operations) 0 0 0 0 Other Income (Minority Interest) -21 -24 27 66 Net Income 3,920.00 2,394.00 6,220.00 9,843.00 -158 Shares Outstanding 2,679.00 2,580.00 2,787.00 2,748.00 Balance Sheet (all data in Millions) 2016 6,515.00 Year Cash And Cash Equivalents 2017 6,092.00 2018 7,965.00 2019 9.676.00 Marketable Securities Cash, Cash Equivalents, Marketable Securities Accounts Receivable Notes Receivable Loans Receivable Other Current Receivables Total Receivables Inventories, Raw Materials & Components Inventories, Work In Process Inventories, Inventories Adjustments Inventories, Finished Goods Inventories, Other Total Inventories Other Current Assets Total Current Assets Investments And Advances Land And Improvements Buildings And Improvements Machinery, Furniture, Equipment Construction In Progress Other Gross PPE Gross Property. Plant and Equipment Accumulated Depreciation Property, Plant and Equipment Intangible Assets Goodwill Other Long Term Assets Total Long-Term Assets Total Assets Accounts Payable Total Tax Payable Other Current Payables Current Accrued Expense 7.826.00 2.406.00 899 774 14.341.00 8.498.00 8.864.00 10.450.00 7.018.00 6.873.00 7.071.00 6.778.00 0 0 0 0 0 0 0 0 0 7,018.00 6.873.00 7.071.00 6.778.00 0 0 0 0 0 0 o 0 0 0 0 0 0 0 0 4,866.00 5,096.00 5,440.00 5.978.00 4,866.00 5,096.00 5.440.00 5.978.00 4,389.00 4.299.00 4,500.00 4.277.00 30.614.00 24,766.00 25.875.00 27.483.00 11.416.00 12.125.00 6.233.00 1.469.00 412 365 333 343 11.439.00 11.726.00 11,486.00 11.989.00 14.053.00 14,649.00 14,441.00 15,394.00 1.871.00 2.301.00 3.355.00 5.013.00 0 0 0 0 27.775.00 29.041.00 29,615.00 32.739. -15.749.00 -16,602.00 -16.324.00 -17.686.00 12.026.00 12.439.00 13.291.00 15.053.00 35.467.00 32.467.00 31,357.00 33,621.00 18.162.00 18.284.00 18.253.00 19,425.00 5,854.00 6.075.00 5.881.00 6.771.00 64.763.00 63.106.00 56.762.00 56.914.00 95,377.00 87.872.00 82,637.00 84,397.00 2.807.00 3.102.00 3,318.00 3.738.00 2.239.00 708 1.971.00 736 1.316.00 1.320.00 1.458.00 1.587.00 10,274.00 10,427.00 10.151.00 12.549.00 17,204.00 24.274.00 18.614.00 21.353.00 0 21.353.00 o 22.206.00 19.806.00 0 22.220.00 221736.00 0 19.806.00 0 Total Current Liabilities Long-Term Debt Long-Term Capital Lease Obligation Long-Term Debt & Capital Lease Obligation Pension And Retirement Benefit NonCurrent Deferred Liabilities Other Long-Term Liabilities Total Long-Term Liabilities Total Liabilities Common Stock Preferred Stock Retained Earnings Accumulated other comprehensive income (loss) Additional Paid-In Capital Treasury Stock Other Stockholders Equity Total Stockholders Equity Minority Interest Total Equity 24,274.00 0 5,077.00 8.514.00 37.865.00 55.069.00 1.788.00 0 44,133.00 1.5.226.00 39.939.00 40,546.00 2.219,00 11.117.00 34.689.00 53.303.00 1.788.00 22,236.00 0 1.470.00 11.920.00 36.176.00 58.396.00 1.788.00 ol 46,602.00 -0,193.00 39.000.00 55.950.00 1.702.00 12.041.00 33.549.00 55.755.00 1.798.00 0 42,579.00 -5.545.00 38.808.00 -50.929.00 0 26,701.00 181 0 41.350.00 -4.910.00 39.902.00 -43.794.00 0 0 40.088.00 220 34 336.00 233 25,907.00 94 40.308.00 34,569.00 26,882.00 26.001.00 2018 2019 6, 193.00 Statement of Cashflow (all data in Millions) Year 2016 2017 Net Income From Continuing Operations 3.941.00 2.418,00 Depreciation, Depletion and Amortization 5.471.00 4.676.00 Change In Receivables 1819 2971 Change In Inventory 200 4145 Change In Prepaid Assets 0 0 Change In Payables And Accrued Expense 11.020.00 3.959.000 Change in Other Working Capital 5772 +1.210.00 4.519.00 418 9,777.00 3.652.00 294 -911 5081 0 716 0 1.584.00 269 1940 -3.202.00 8,622.00 O Purchase Of Investment Sale Of Investment Net Intangibles Purchase And Sale Cash From Discontinued Investing Activities Cash From Other Investing Activities Cash Flow from Investing Issuance of Stock Repurchase of Stock Net Issuance of Preferred Stock Net Issuance of Debt Cash Flow for Dividends Other Financing Cash Flow from Financing - 15,651.00 -10.739.00 -7.994.00 14,353.00 15,664.00 15.252.00 0 0 0 0 ol 0 482 38 102 -3.210.00 2,679.00 4,314.00 0 0 0 -3,434.00 -4.014.00 -9,091.00 0 0 0 -1,307.00 -1.129.00 837 -5.124.00 -5.167.00 -5.172.00 821 304 266 -9,044.00 -10,006.00 -13,160.00 378 -2,629.00 0 -4.780.00 0 1,248.00 -5,695.00 366 -8,861.00

