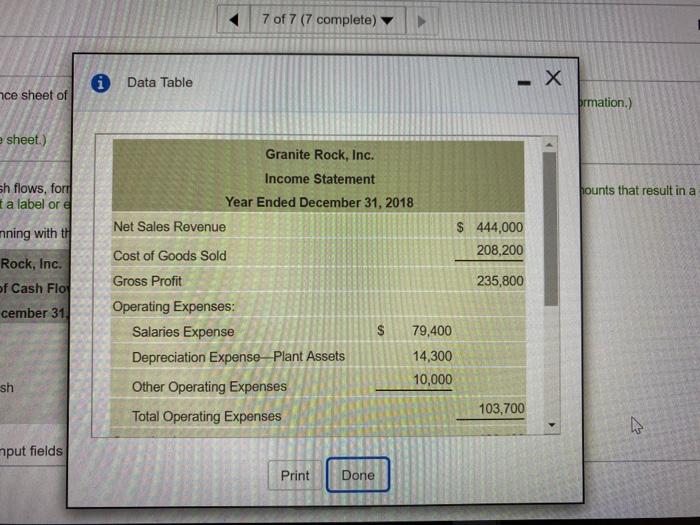
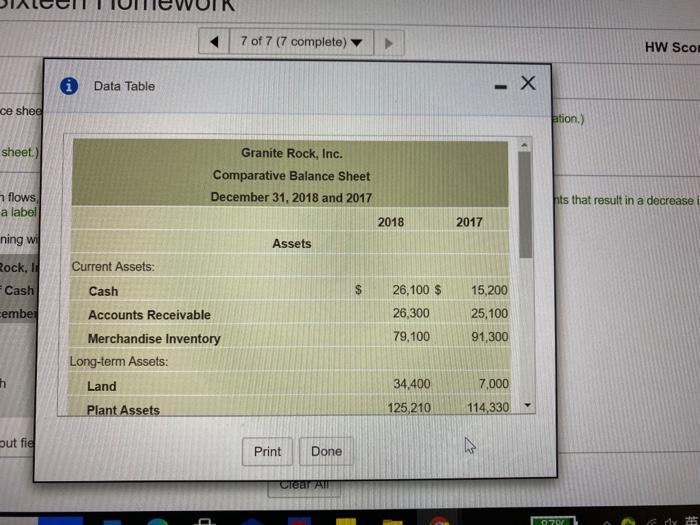
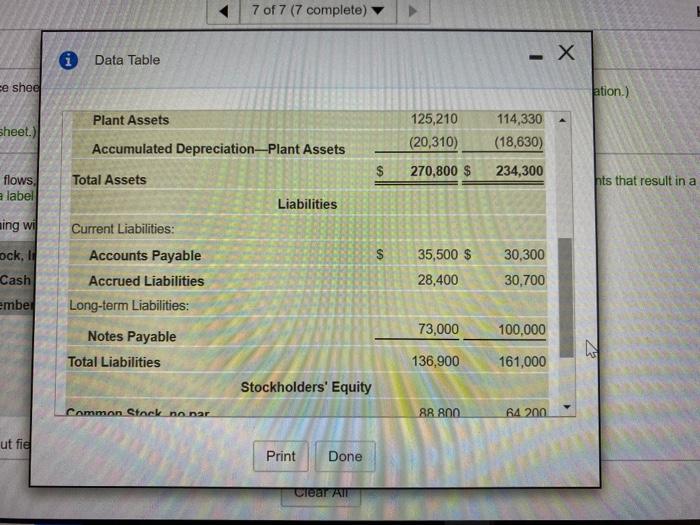
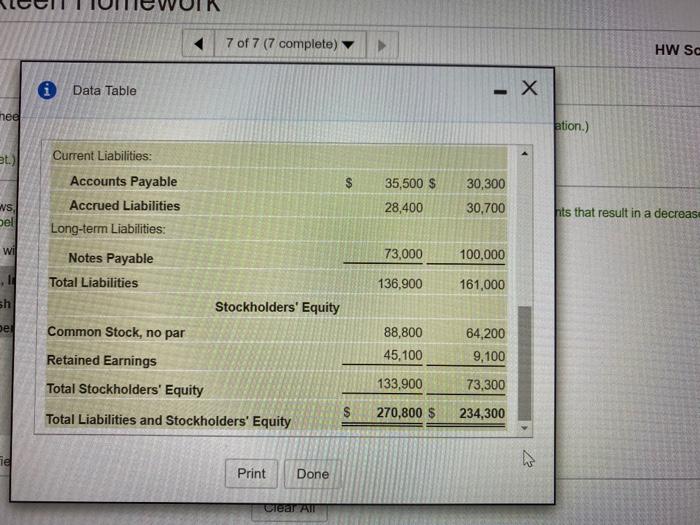
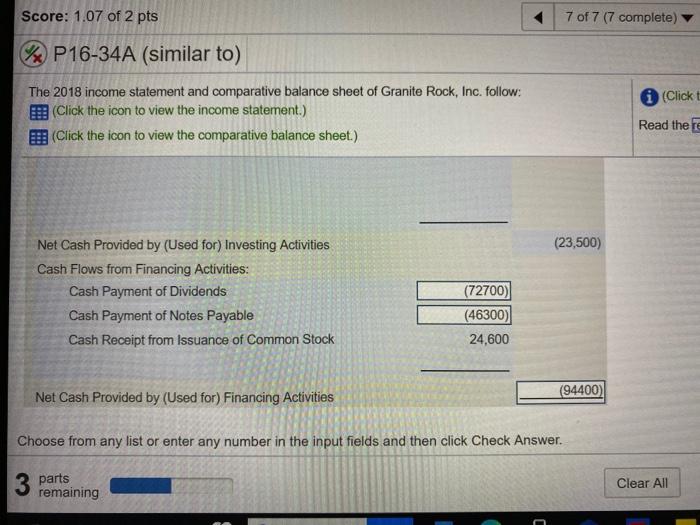
7 of 7 (7 complete) Data Table - X nce sheet of brmation.) sheet.) sh flows, for ta label or Granite Rock, Inc. Income Statement Year Ended December 31, 2018 Net Sales Revenue Founts that result in a mning with the $ 444,000 208,200 Rock, Inc. of Cash Flo 235,800 cember 31 $ Cost of Goods Sold Gross Profit Operating Expenses: Salaries Expense Depreciation Expense Plant Assets Other Operating Expenses Total Operating Expenses 79,400 14,300 10,000 sh 103,700 7 mput fields Print Done 7 of 7 (7 complete) HW Scol * Data Table - X ce shee Btion.) sheet.) Granite Rock, Inc. Comparative Balance Sheet December 31, 2018 and 2017 flows a label hts that result in a decrease 2018 2017 ning wil Assets Rock, Cash $ 26,100 $ 15,200 25,100 cembe 26,300 Current Assets: Cash Accounts Receivable Merchandise Inventory Long-term Assets: Land Plant Assets 79,100 91,300 34.400 7,000 125,210 114,330 out fie . Print Done Cred AT d 0707 dy 2 7 of 7 (7 complete) - X Data Table ce shee ation.) Plant Assets 114,330 sheet.) 125,210 (20,310) Accumulated Depreciation-Plant Assets (18,630) $ 270,800 $ 234,300 flows a label Total Assets nts that result in a Liabilities ning wil $ ock, Cash embe Current Liabilities: Accounts Payable Accrued Liabilities Long-term Liabilities: 35,500 $ 28,400 30,300 30,700 73,000 100,000 Notes Payable Total Liabilities N 136,900 161,000 Stockholders' Equity Common Stock nonar 88 800 64 200 ut fic Print Done Clear All 7 of 7 (7 complete) HW SC Data Table - X thee Btion.) et.) $ 30,300 Current Liabilities: Accounts Payable Accrued Liabilities Long-term Liabilities: 35,500 $ 28,400 ws bel 30,700 hts that result in a decrease wi 73,000 100,000 Notes Payable Total Liabilities 136.900 161,000 sh Stockholders' Equity he Common Stock, no par Retained Earnings Total Stockholders' Equity 88,800 45.100 64,200 9,100 133,900 73,300 $ Total Liabilities and Stockholders' Equity 270,800 $ 234,300 el Print Done Clear All Score: 1.07 of 2 pts 7 of 7 (7 complete) WP16-34A (similar to) i (Clickt The 2018 income statement and comparative balance sheet of Granite Rock, Inc. follow: (Click the icon to view the income statement.) (Click the icon to view the comparative balance sheet.) Read the re (23,500) Net Cash Provided by (Used for) Investing Activities Cash Flows from Financing Activities: Cash Payment of Dividends Cash Payment of Notes Payable Cash Receipt from Issuance of Common Stock (72700) (46300) 24,600 Net Cash Provided by (Used for) Financing Activities (94400) Choose from any list or enter any number in the input fields and then click Check Answer. 3 parts Clear All remaining 7 of 7 (7 complete) Data Table - X nce sheet of brmation.) sheet.) sh flows, for ta label or Granite Rock, Inc. Income Statement Year Ended December 31, 2018 Net Sales Revenue Founts that result in a mning with the $ 444,000 208,200 Rock, Inc. of Cash Flo 235,800 cember 31 $ Cost of Goods Sold Gross Profit Operating Expenses: Salaries Expense Depreciation Expense Plant Assets Other Operating Expenses Total Operating Expenses 79,400 14,300 10,000 sh 103,700 7 mput fields Print Done 7 of 7 (7 complete) HW Scol * Data Table - X ce shee Btion.) sheet.) Granite Rock, Inc. Comparative Balance Sheet December 31, 2018 and 2017 flows a label hts that result in a decrease 2018 2017 ning wil Assets Rock, Cash $ 26,100 $ 15,200 25,100 cembe 26,300 Current Assets: Cash Accounts Receivable Merchandise Inventory Long-term Assets: Land Plant Assets 79,100 91,300 34.400 7,000 125,210 114,330 out fie . Print Done Cred AT d 0707 dy 2 7 of 7 (7 complete) - X Data Table ce shee ation.) Plant Assets 114,330 sheet.) 125,210 (20,310) Accumulated Depreciation-Plant Assets (18,630) $ 270,800 $ 234,300 flows a label Total Assets nts that result in a Liabilities ning wil $ ock, Cash embe Current Liabilities: Accounts Payable Accrued Liabilities Long-term Liabilities: 35,500 $ 28,400 30,300 30,700 73,000 100,000 Notes Payable Total Liabilities N 136,900 161,000 Stockholders' Equity Common Stock nonar 88 800 64 200 ut fic Print Done Clear All 7 of 7 (7 complete) HW SC Data Table - X thee Btion.) et.) $ 30,300 Current Liabilities: Accounts Payable Accrued Liabilities Long-term Liabilities: 35,500 $ 28,400 ws bel 30,700 hts that result in a decrease wi 73,000 100,000 Notes Payable Total Liabilities 136.900 161,000 sh Stockholders' Equity he Common Stock, no par Retained Earnings Total Stockholders' Equity 88,800 45.100 64,200 9,100 133,900 73,300 $ Total Liabilities and Stockholders' Equity 270,800 $ 234,300 el Print Done Clear All Score: 1.07 of 2 pts 7 of 7 (7 complete) WP16-34A (similar to) i (Clickt The 2018 income statement and comparative balance sheet of Granite Rock, Inc. follow: (Click the icon to view the income statement.) (Click the icon to view the comparative balance sheet.) Read the re (23,500) Net Cash Provided by (Used for) Investing Activities Cash Flows from Financing Activities: Cash Payment of Dividends Cash Payment of Notes Payable Cash Receipt from Issuance of Common Stock (72700) (46300) 24,600 Net Cash Provided by (Used for) Financing Activities (94400) Choose from any list or enter any number in the input fields and then click Check Answer. 3 parts Clear All remaining
