Answered step by step
Verified Expert Solution
Question
1 Approved Answer
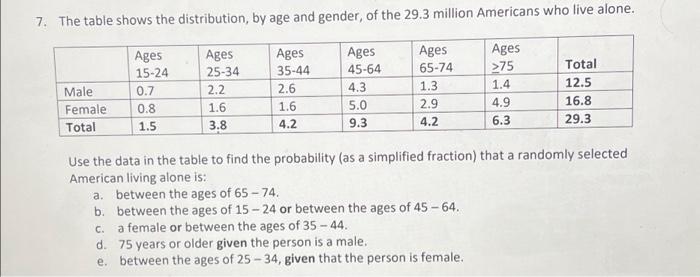
7. The table shows the distribution, by age and gender, of the 29.3 million Americans who live alone. Ages 15-24 Ages 25-34 Male Female Total
7. The table shows the distribution, by age and gender, of the 29.3 million Americans who live alone. Ages 15-24 Ages 25-34 Male Female Total 0.7 0.8 1.5 2.2 1.6 3.8 Ages 35-44 2.6 1.6 4.2 Ages 45-64 4.3 5.0 9.3 Ages 65-74 1.3 2.9 4.2 Ages >75 1.4 4.9 6.3 Total 12.5 16.8 29.3 Use the data in the table to find the probability (as a simplified fraction) that a randomly selected American living alone is: a. between the ages of 65 - 74. b. between the ages of 15-24 or between the ages of 45 - 64. C. a female or between the ages of 35 - 44. d. 75 years or older given the person is a male. e. between the ages of 25-34, given that the person is female.

Step by Step Solution
There are 3 Steps involved in it
Step: 1

Get Instant Access to Expert-Tailored Solutions
See step-by-step solutions with expert insights and AI powered tools for academic success
Step: 2

Step: 3

Ace Your Homework with AI
Get the answers you need in no time with our AI-driven, step-by-step assistance
Get Started


