Answered step by step
Verified Expert Solution
Link Copied!

Question

1 Approved Answer

7. This is the Excel ordinary least squares regression output where the returns on the US MSCI stock index are the dependent variable (Y variable)
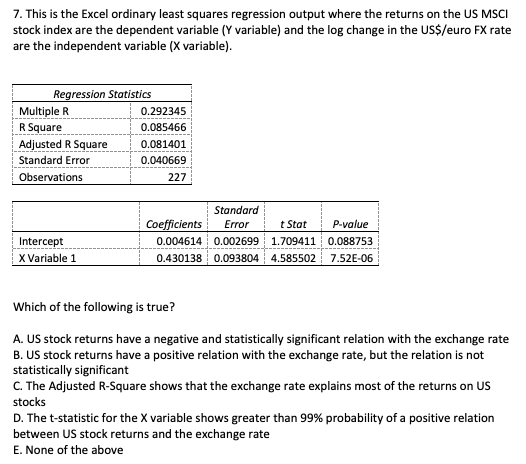
image text in transcribed

7. This is the Excel ordinary least squares regression output where the returns on the US MSCI stock index are the dependent variable (Y variable) and the log change in the US$/euro FX rate are the independent variable (X variable). Regression Statistics Multiple R 0.292345 R Square 0.085466 Adjusted R Square 0.081401 Standard Error 0.040669 Observations 227 Intercept X Variable 1 Standard Coefficients Error t Star P-value 0.004614 0.002699 1.709411 0.088753 0.430138 0.093804 4.585502 7.52E-06 Which of the following is true? A. US stock returns have a negative and statistically significant relation with the exchange rate B. US stock returns have a positive relation with the exchange rate, but the relation is not statistically significant C. The Adjusted R-Square shows that the exchange rate explains most of the returns on US stocks D. The t-statistic for the X variable shows greater than 99% probability of a positive relation between US stock returns and the exchange rate E. None of the above 7. This is the Excel ordinary least squares regression output where the returns on the US MSCI stock index are the dependent variable (Y variable) and the log change in the US$/euro FX rate are the independent variable (X variable). Regression Statistics Multiple R 0.292345 R Square 0.085466 Adjusted R Square 0.081401 Standard Error 0.040669 Observations 227 Intercept X Variable 1 Standard Coefficients Error t Star P-value 0.004614 0.002699 1.709411 0.088753 0.430138 0.093804 4.585502 7.52E-06 Which of the following is true? A. US stock returns have a negative and statistically significant relation with the exchange rate B. US stock returns have a positive relation with the exchange rate, but the relation is not statistically significant C. The Adjusted R-Square shows that the exchange rate explains most of the returns on US stocks D. The t-statistic for the X variable shows greater than 99% probability of a positive relation between US stock returns and the exchange rate E. None of the above

Step by Step Solution

There are 3 Steps involved in it

Step: 1

blur-text-image

Get Instant Access to Expert-Tailored Solutions

See step-by-step solutions with expert insights and AI powered tools for academic success

Step: 2

blur-text-image_2

Step: 3

blur-text-image_3

Ace Your Homework with AI

Get the answers you need in no time with our AI-driven, step-by-step assistance

Get Started

Recommended Textbook for

Petromania Black Gold Paper Barrels And Oil Price Bubbles

Authors: Daniel O'Sullivan

1st Edition

1906659249,190665977X

More Books

Students also viewed these Finance questions