

Answered step by step
Verified Expert Solution
Question
1 Approved Answer
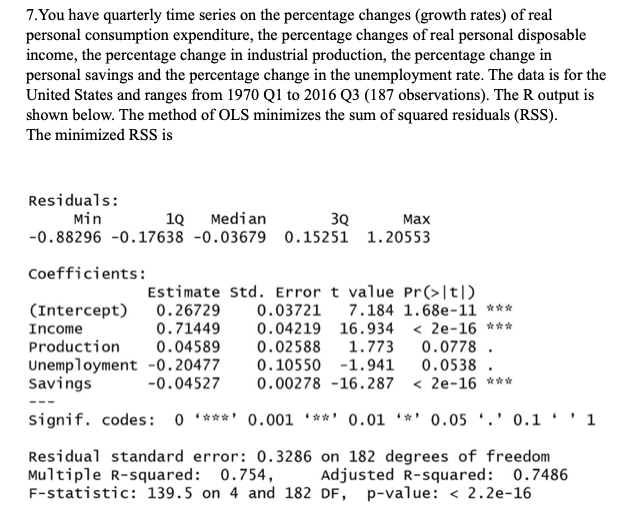
7. You have quarterly time series on the percentage changes (growth rates) of real personal consumption expenditure, the percentage changes of real personal disposable income,
Step by Step Solution
There are 3 Steps involved in it
Step: 1

Get Instant Access to Expert-Tailored Solutions
See step-by-step solutions with expert insights and AI powered tools for academic success
Step: 2

Step: 3
Ace Your Homework with AI
Get the answers you need in no time with our AI-driven, step-by-step assistance
Get Started
Financial Regulation In The EU From Resilience To Growth
Authors: Raphaël Douady , Clément Goulet, Pierre-Charles Pradier
1st Edition
3319442864,3319442872