Answered step by step
Verified Expert Solution
Question
1 Approved Answer
7:07 AM Wed Aug 28 . . . 100% C files-cdn.schoology.com WRITING A SINUSOIDAL MODEL 1. The average monthly temperatures for the city of Seattle,
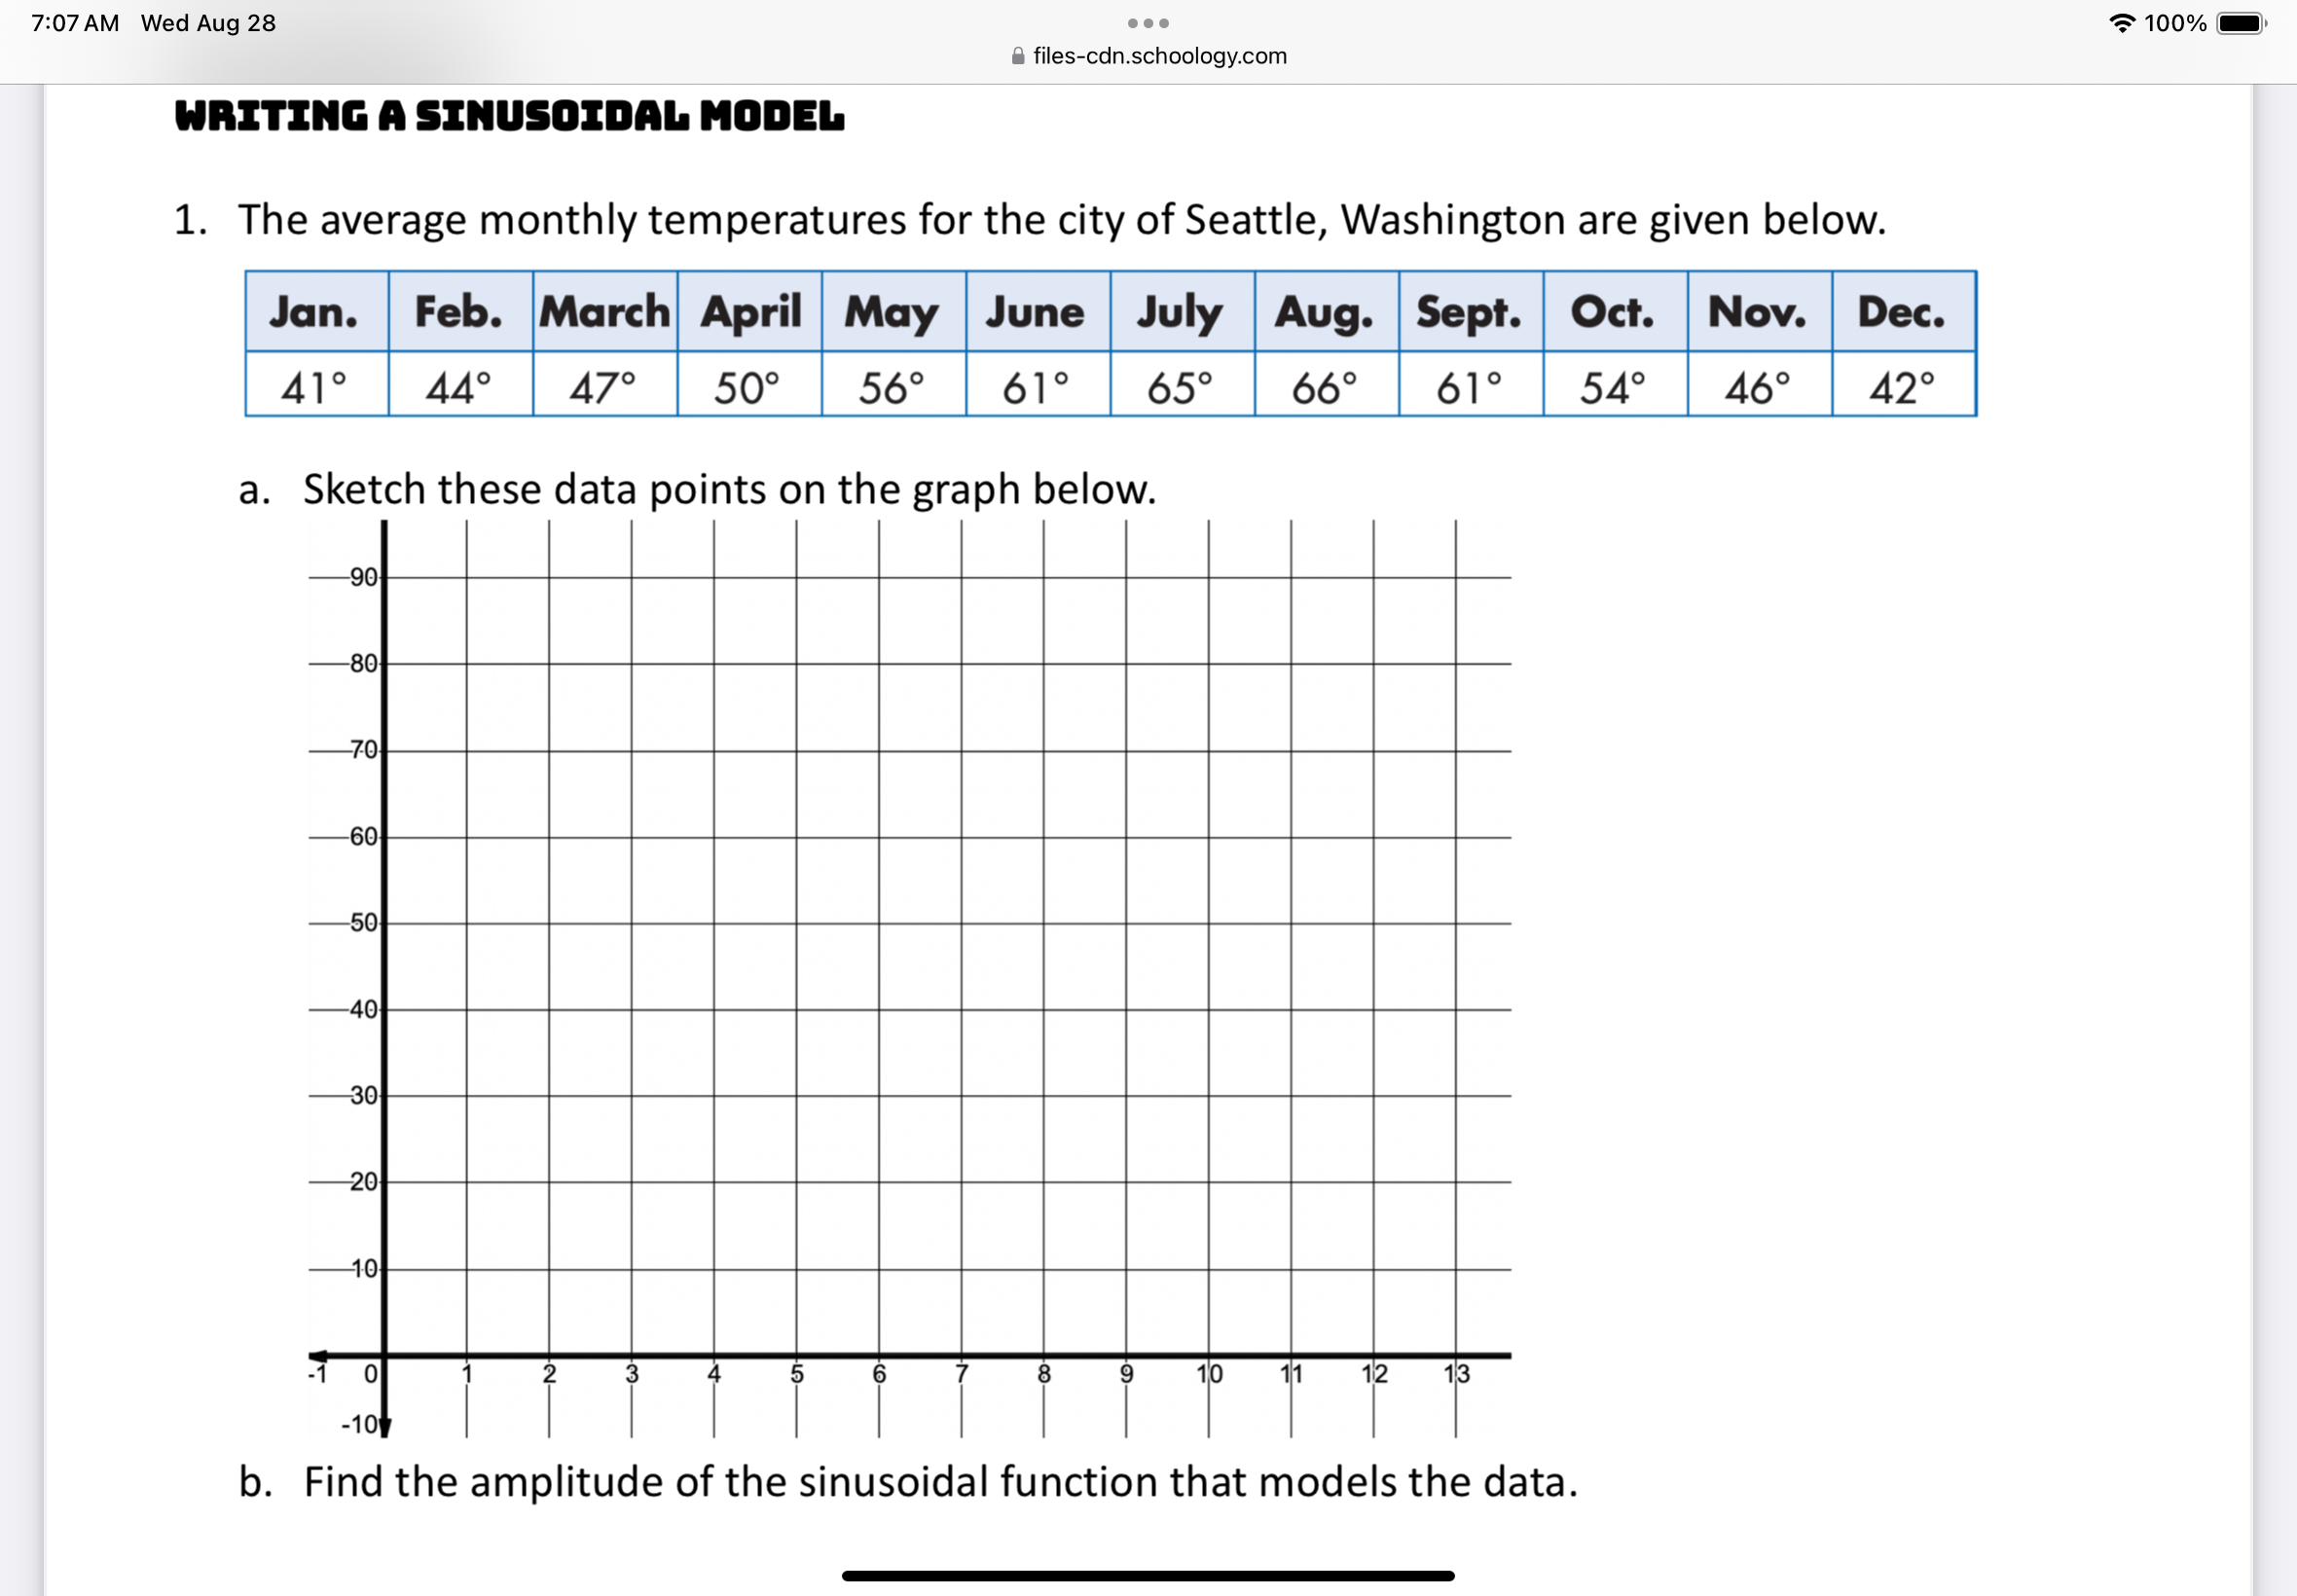
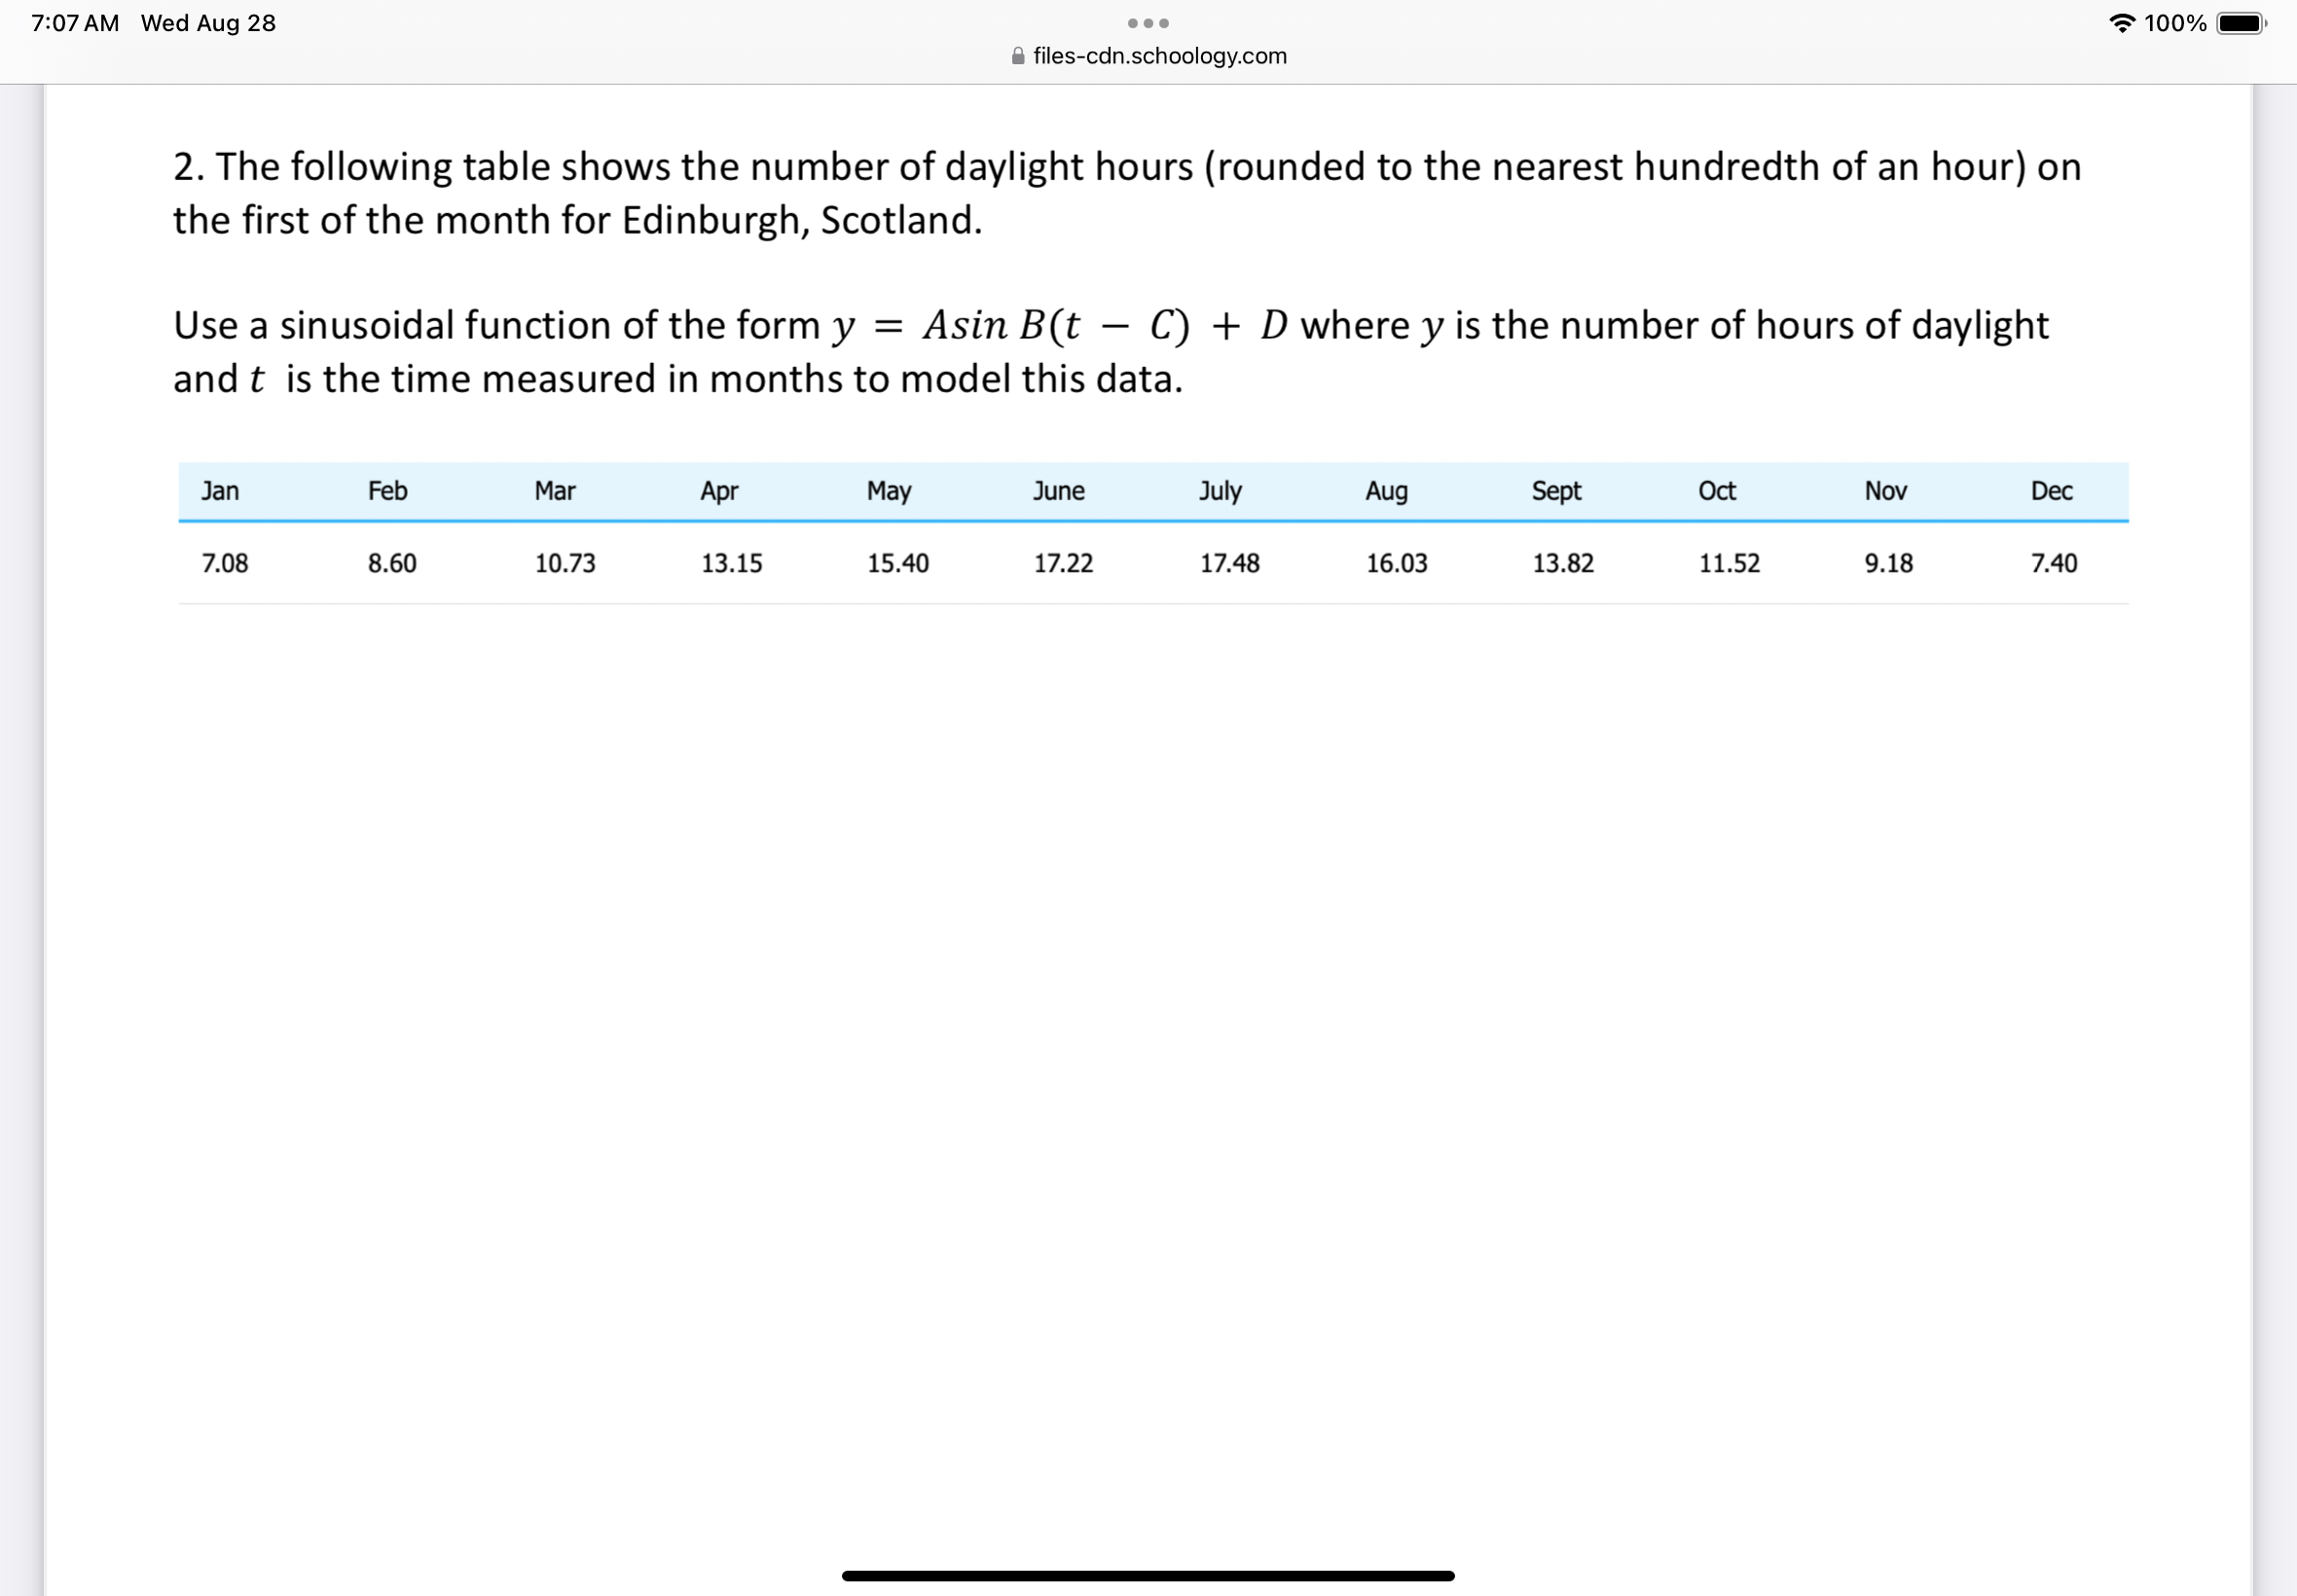
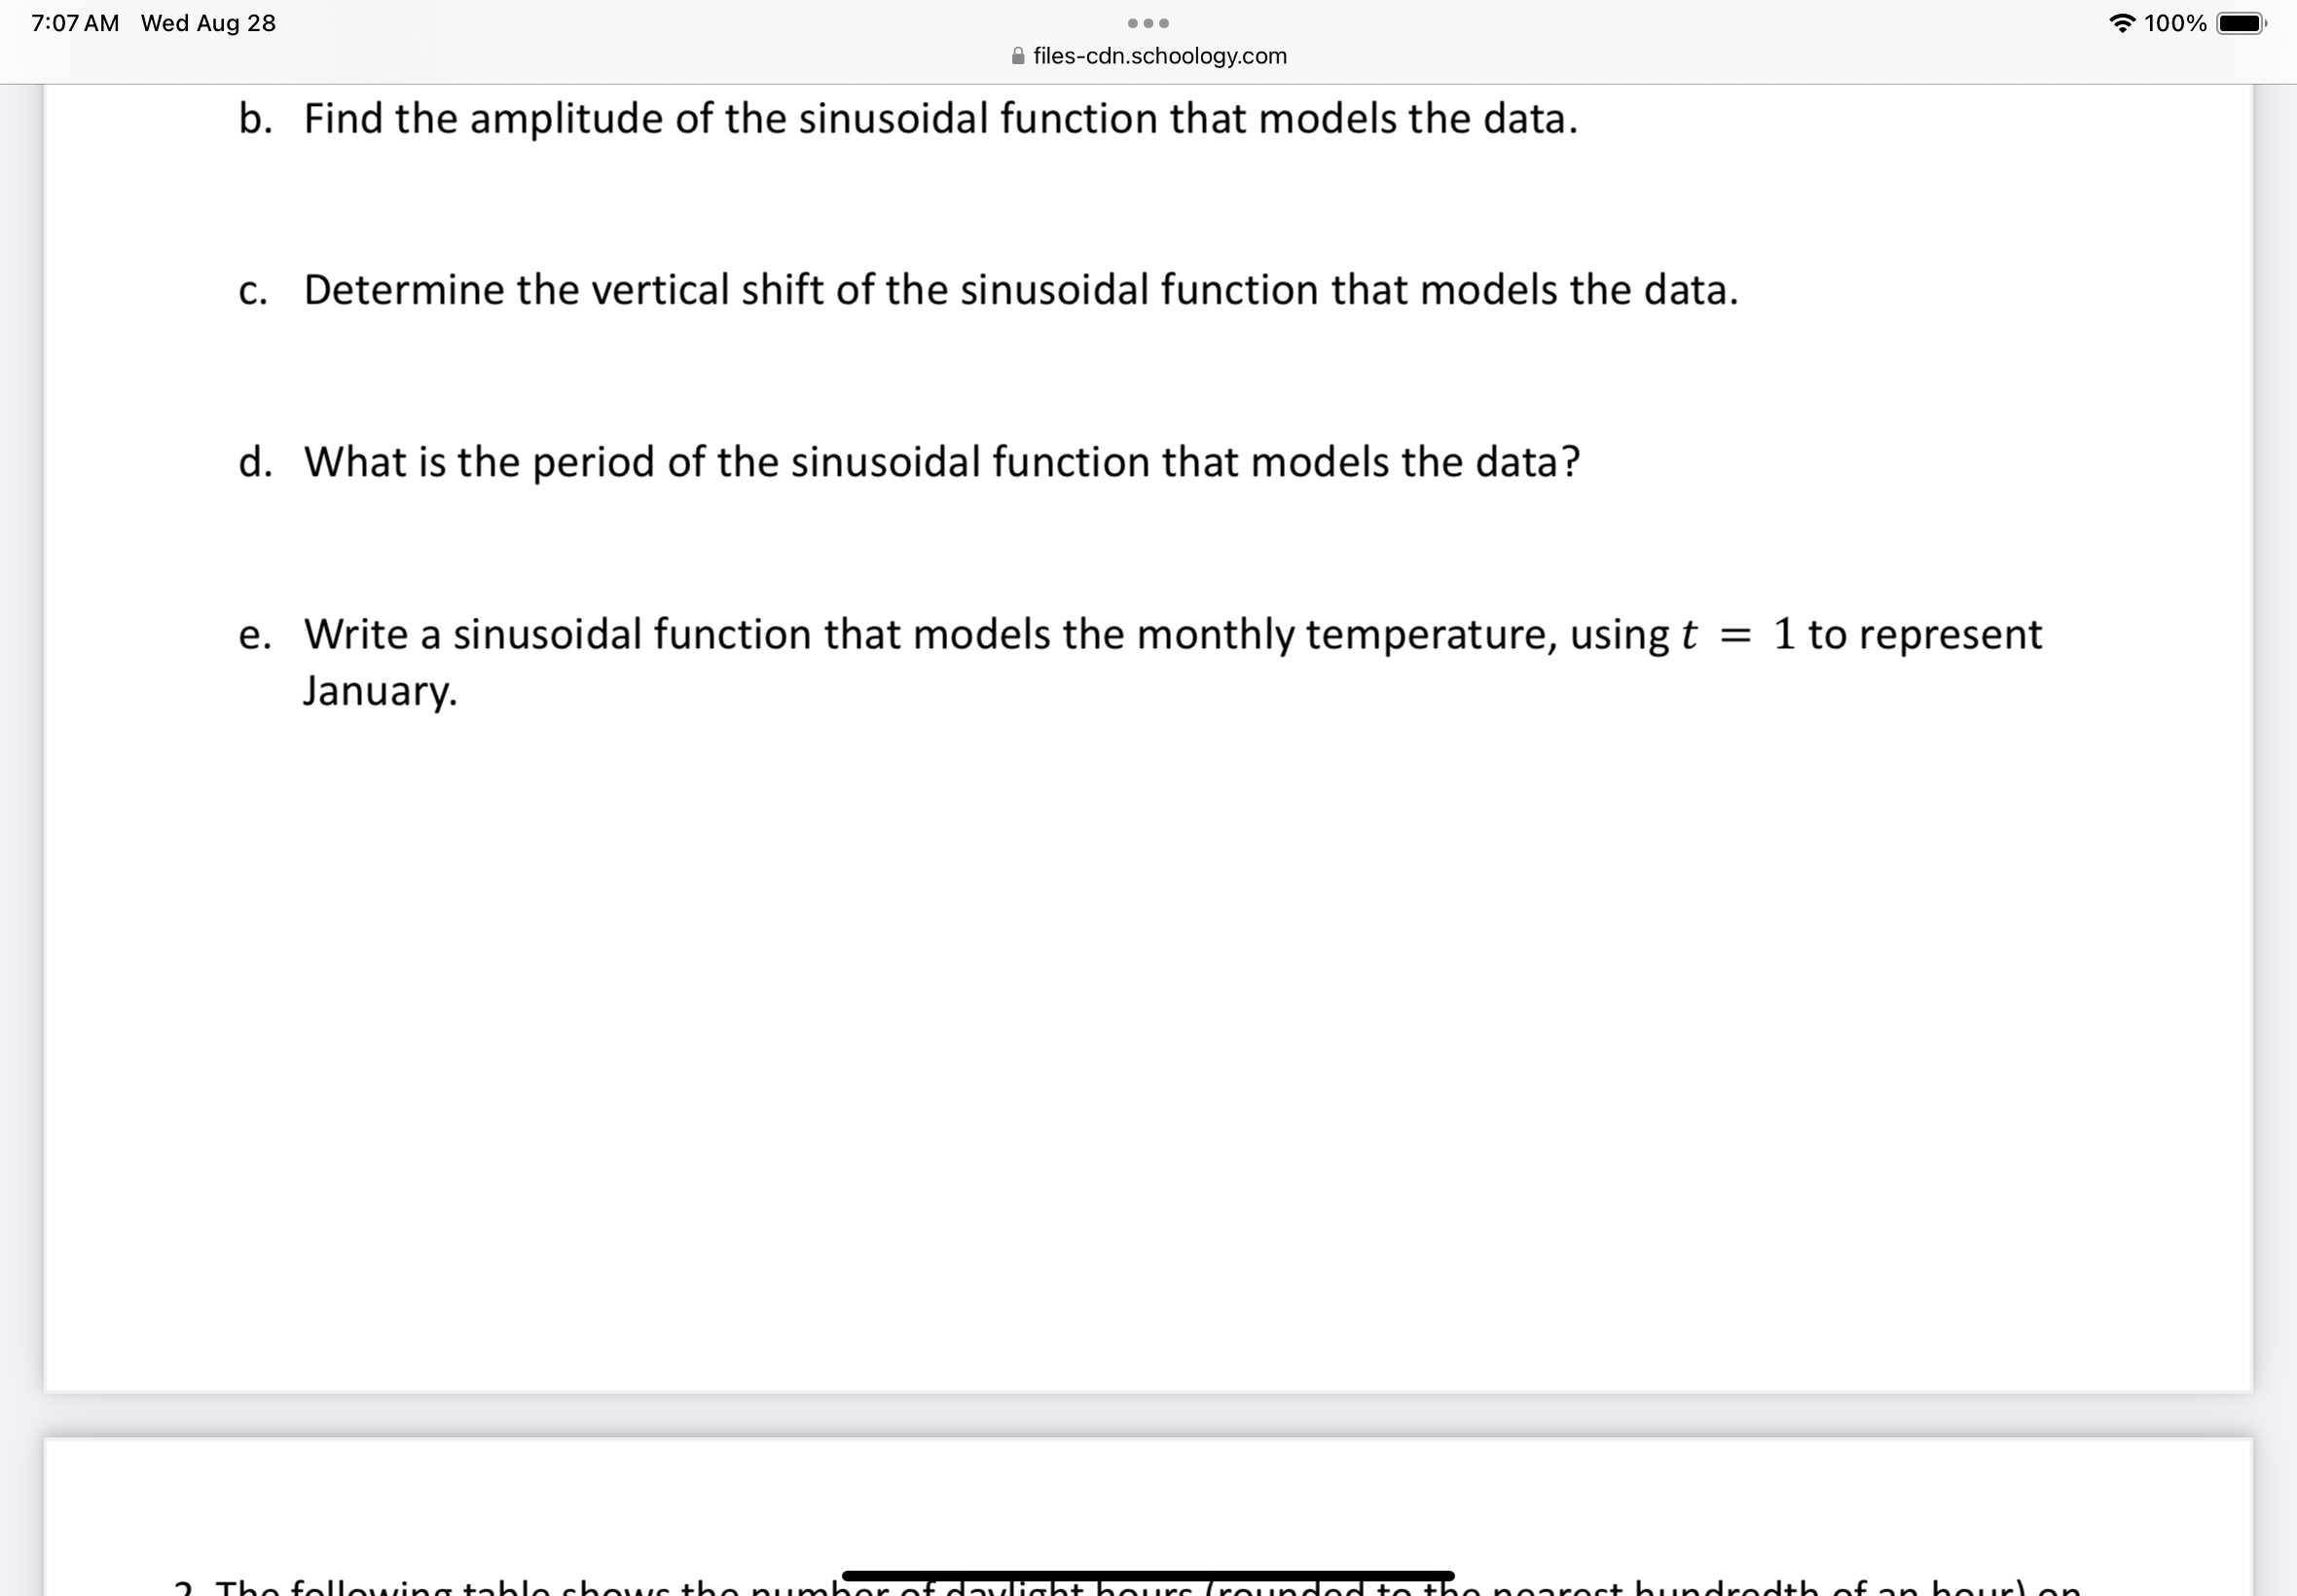
7:07 AM Wed Aug 28 . . . 100% C files-cdn.schoology.com WRITING A SINUSOIDAL MODEL 1. The average monthly temperatures for the city of Seattle, Washington are given below. Jan. Feb. March April May June July Aug. Sept. Oct. Nov. Dec. 410 440 470 50 56 610 650 660 610 540 460 420 a. Sketch these data points on the graph below. 90 80 -70 60 50 -40 30 20 10 0 -N. - Go. 8 -co. 10 11 12 13 b. Find the amplitude of the sinusoidal function that models the data.7:07 AM Wed Aug 28 . . . 100% C files-cdn.schoology.com b. Find the amplitude of the sinusoidal function that models the data. c. Determine the vertical shift of the sinusoidal function that models the data. d. What is the period of the sinusoidal function that models the data? e. Write a sinusoidal function that models the monthly temperature, using t = 1 to represent January.7:07 AM Wed Aug 28 . . . 100% C files-cdn.schoology.com 2. The following table shows the number of daylight hours (rounded to the nearest hundredth of an hour) on the first of the month for Edinburgh, Scotland. Use a sinusoidal function of the form y = Asin B(t - C) + D where y is the number of hours of daylight and t is the time measured in months to model this data. Jan Feb Mar Apr May June July Aug Sept Oct Nov Dec 7.08 8.60 10.73 13.15 15.40 17.22 17.48 16.03 13.82 11.52 9.18 7.40
Step by Step Solution
There are 3 Steps involved in it
Step: 1
Get Instant Access to Expert-Tailored Solutions
See step-by-step solutions with expert insights and AI powered tools for academic success
Step: 2
Step: 3
Ace Your Homework with AI
Get the answers you need in no time with our AI-driven, step-by-step assistance
Get Started