

Question
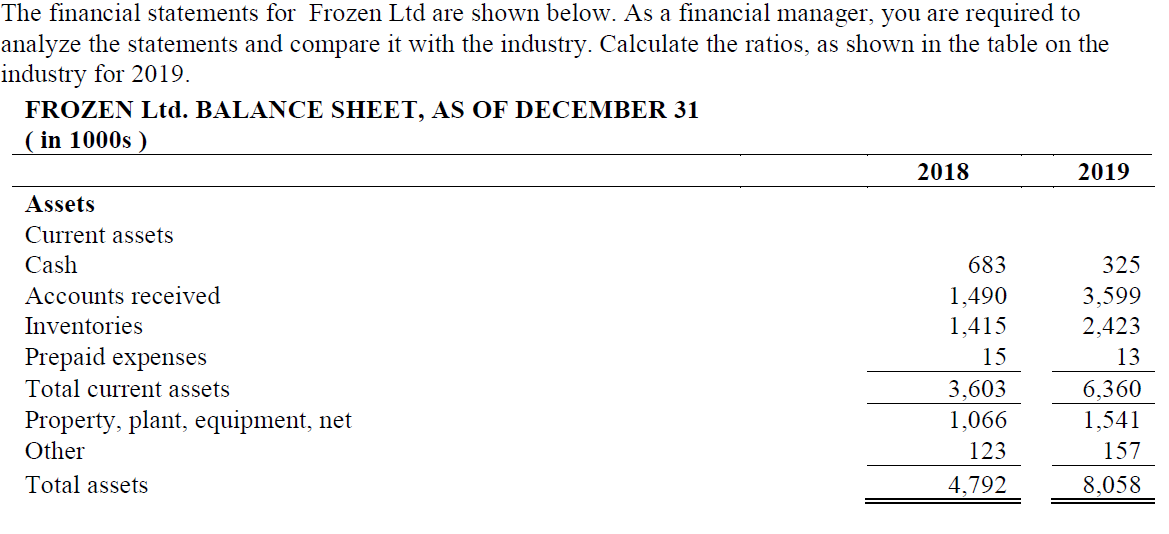
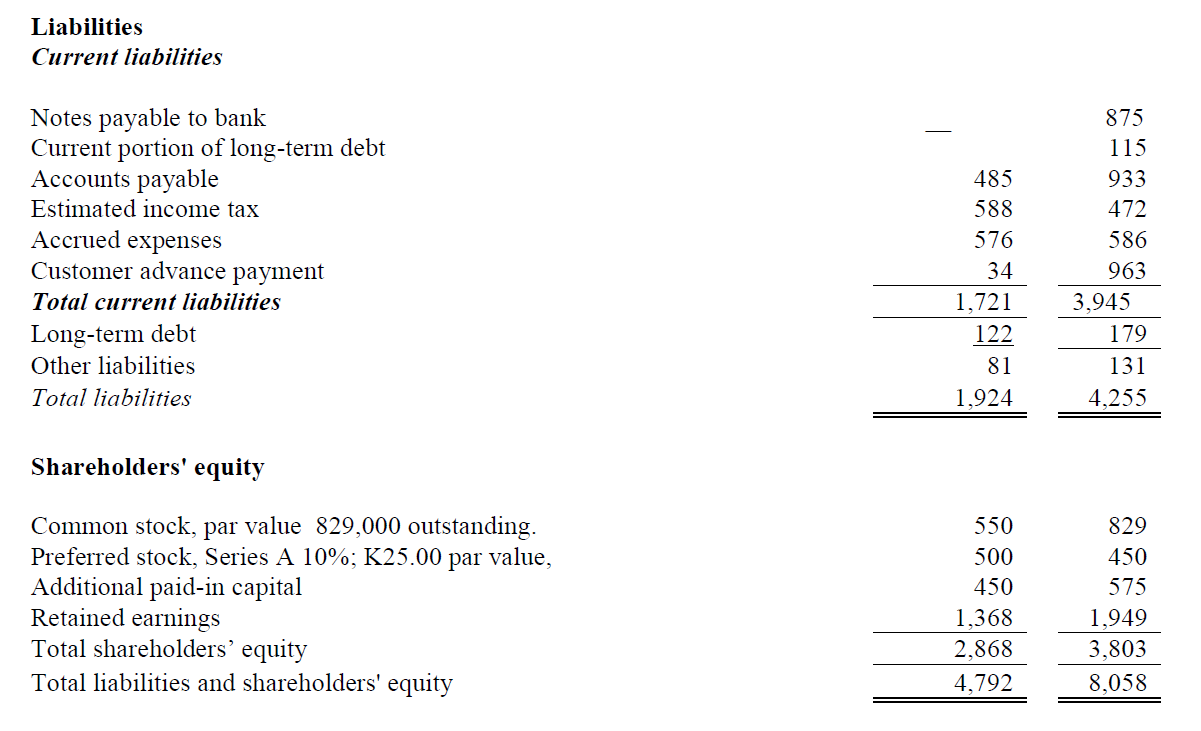
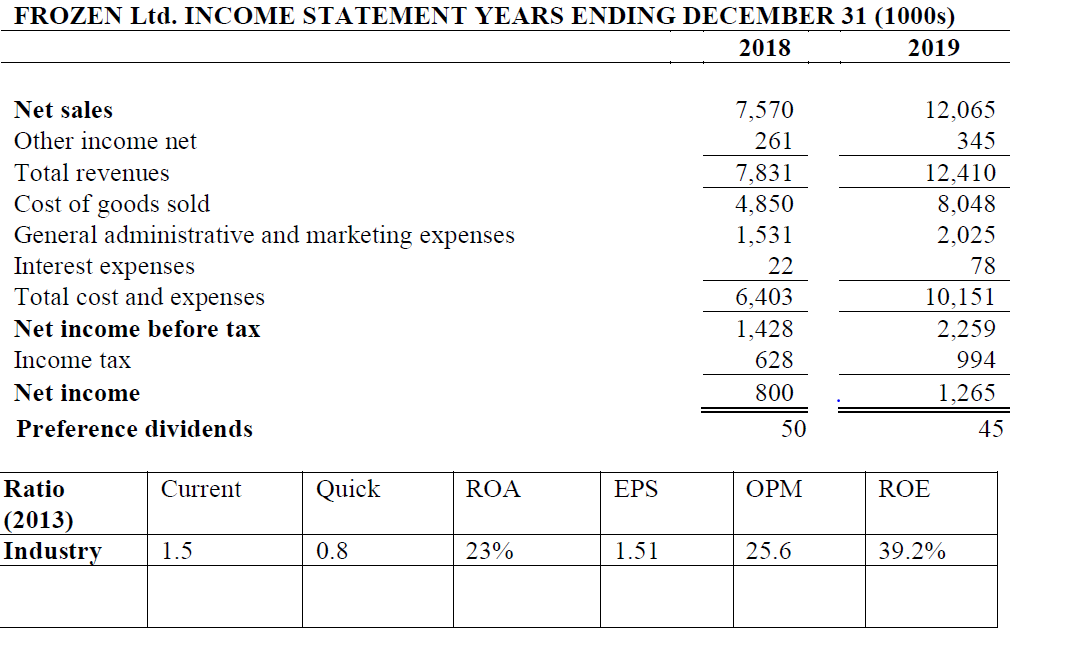
7.1. Calculate the six ratios (as shown in the table below), for 2019.Insert your solution in the table above (no workings are required). (12) 7.2.
7.1. Calculate the six ratios (as shown in the table below), for 2019.Insert your solution in the table above (no workings are required). (12) 7.2. Discuss the performance of Iceland with the industry for 2019 in terms of liquidity and profitability.
Step by Step Solution
There are 3 Steps involved in it
Step: 1

Get Instant Access to Expert-Tailored Solutions
See step-by-step solutions with expert insights and AI powered tools for academic success
Step: 2

Step: 3
Ace Your Homework with AI
Get the answers you need in no time with our AI-driven, step-by-step assistance
Get Started
International Project Finance
Authors: Felix I. Lessambo
1st Edition
3030963896, 978-3030963897