7:14 pm Sun 21 Mar < moodle.uowplatform.edu.au Expected return FIN 223 Investment Analysis Tutorial 3 Portfolio Theory 1. How does the level of risk

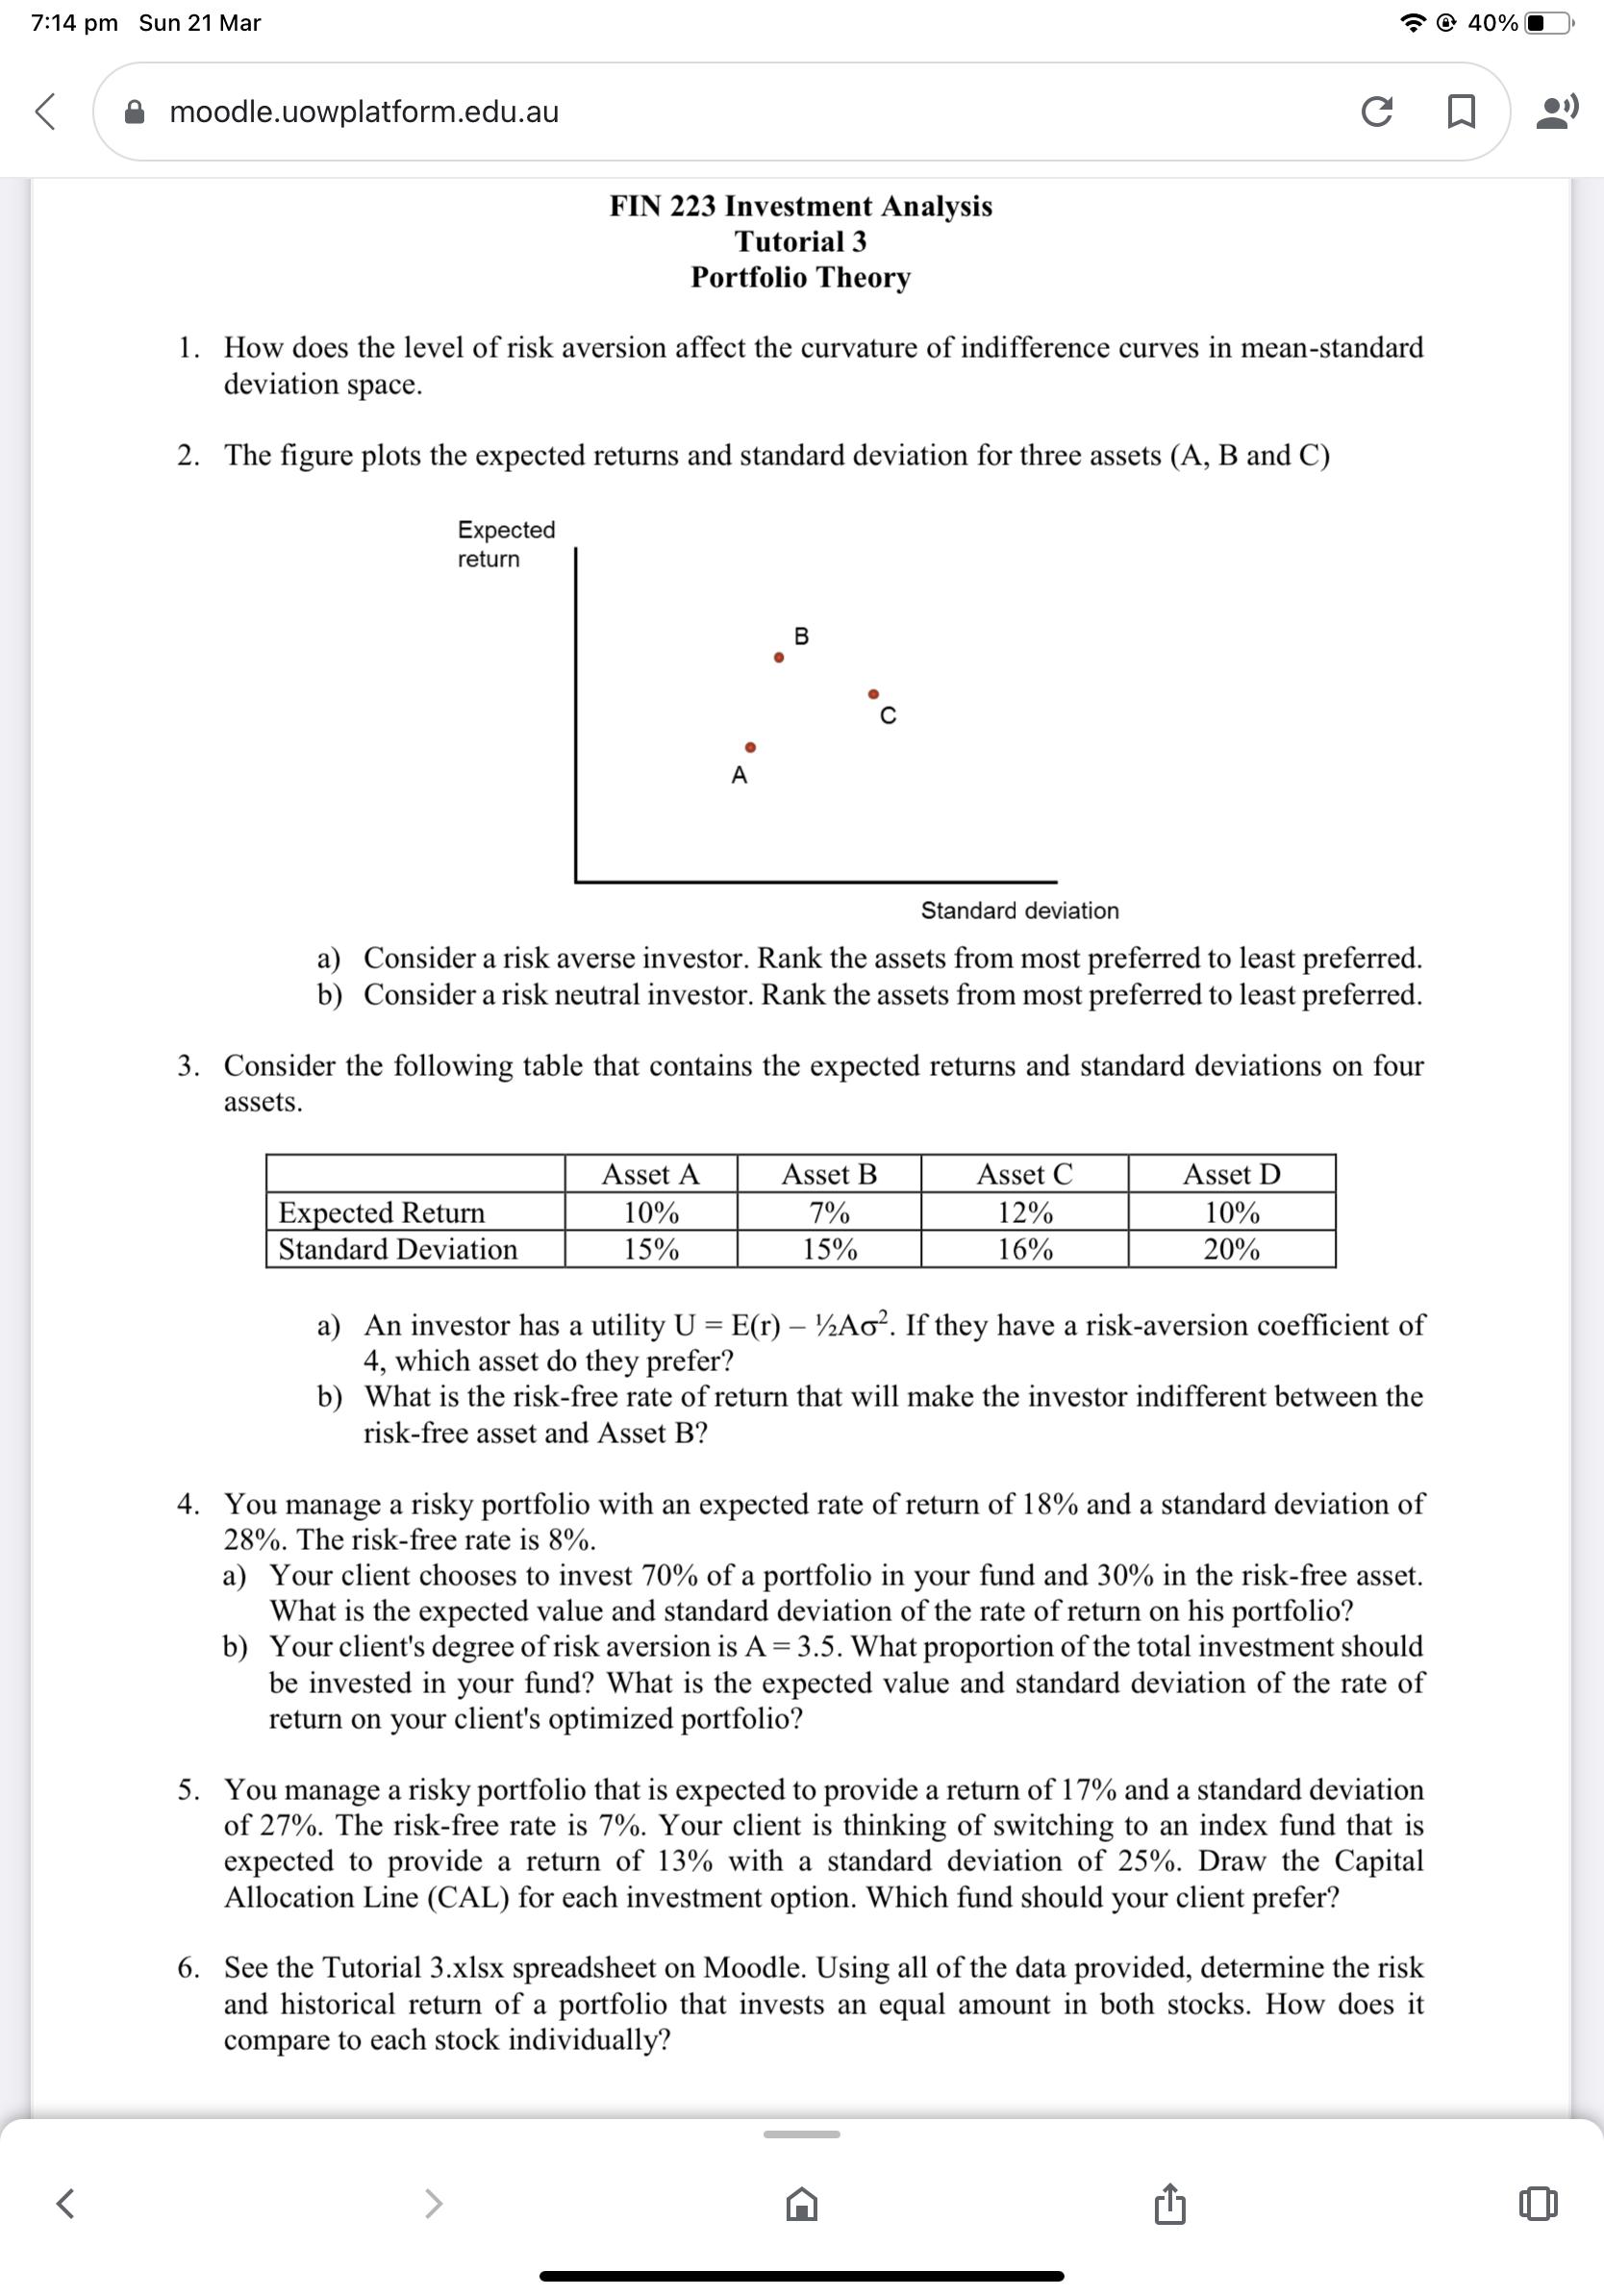
7:14 pm Sun 21 Mar < moodle.uowplatform.edu.au Expected return FIN 223 Investment Analysis Tutorial 3 Portfolio Theory 1. How does the level of risk aversion affect the curvature of indifference curves in mean-standard deviation space. 2. The figure plots the expected returns and standard deviation for three assets (A, B and C) Expected Return Standard Deviation A B Standard deviation a) Consider a risk averse investor. Rank the assets from most preferred to least preferred. b) Consider a risk neutral investor. Rank the assets from most preferred to least preferred. Asset A 10% 15% 3. Consider the following table that contains the expected returns and standard deviations on four assets. Asset B 7% 15% Asset C 12% 16% Asset D 10% 20% a) An investor has a utility U = E(r) Ao. If they have a risk-aversion coefficient of 4, which asset do they prefer? b) What is the risk-free rate of return that will make the investor indifferent between the risk-free asset and Asset B? 4. You manage a risky portfolio with an expected rate of return of 18% and a standard deviation of 28%. The risk-free rate is 8%. a) Your client chooses to invest 70% of a portfolio in your fund and 30% in the risk-free asset. What is the expected value and standard deviation of the rate of return on his portfolio? b) Your client's degree of risk aversion is A = 3.5. What proportion of the total investment should be invested in your fund? What is the expected value and standard deviation of the rate of return on your client's optimized portfolio? 5. You manage a risky portfolio that is expected to provide a return of 17% and a standard deviation of 27%. The risk-free rate is 7%. Your client is thinking of switching to an index fund that is expected to provide a return of 13% with a standard deviation of 25%. Draw the Capital Allocation Line (CAL) for each investment option. Which fund should your client prefer? 6. See the Tutorial 3.xlsx spreadsheet on Moodle. Using all of the data provided, determine the risk and historical return of a portfolio that invests an equal amount in both stocks. How does it compare to each stock individually? 40%
Step by Step Solution
3.43 Rating (150 Votes )
There are 3 Steps involved in it
Step: 1
1 The level of risk aversion affects the curvature of indifference curves in meanstandard deviation space Higher levels of risk aversion result in more concave indifference curves indicating a greater ...
See step-by-step solutions with expert insights and AI powered tools for academic success
Step: 2

Step: 3

Ace Your Homework with AI
Get the answers you need in no time with our AI-driven, step-by-step assistance
Get Started


