Answered step by step
Verified Expert Solution
Question
1 Approved Answer
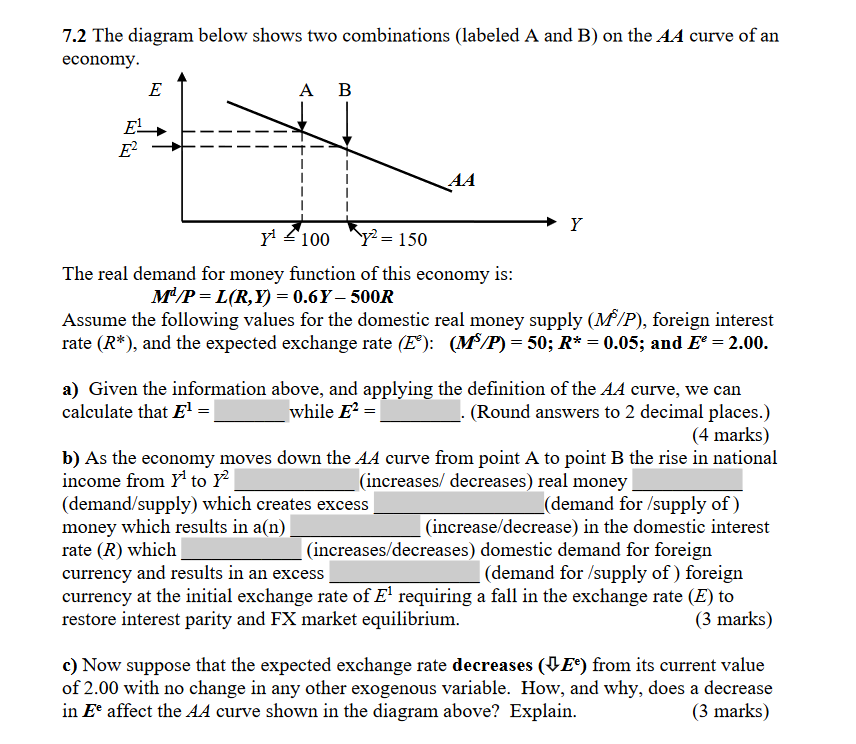
7.2 The diagram below shows two combinations (labeled A and B) on the AA curve of an economy. E A B E E AA

7.2 The diagram below shows two combinations (labeled A and B) on the AA curve of an economy. E A B E E AA Y y 100 y2=150 The real demand for money function of this economy is: M/P=L(R,Y) = 0.6Y-500R Assume the following values for the domestic real money supply (MS/P), foreign interest rate (R*), and the expected exchange rate (E): (MS/P) = 50; R* = 0.05; and E = 2.00. a) Given the information above, and applying the definition of the AA curve, we can calculate that E = (Round answers to 2 decimal places.) while E = (4 marks) b) As the economy moves down the AA curve from point A to point B the rise in national income from Y to Y2 (increases/ decreases) real money (demand/supply) which creates excess money which results in a(n) rate (R) which (demand for /supply of) (increase/decrease) in the domestic interest (demand for /supply of) foreign (increases/decreases) domestic demand for foreign currency and results in an excess currency at the initial exchange rate of E requiring a fall in the exchange rate (E) to restore interest parity and FX market equilibrium. (3 marks) c) Now suppose that the expected exchange rate decreases (E) from its current value of 2.00 with no change in any other exogenous variable. How, and why, does a decrease in Ee affect the AA curve shown in the diagram above? Explain. (3 marks)
Step by Step Solution
There are 3 Steps involved in it
Step: 1

Get Instant Access to Expert-Tailored Solutions
See step-by-step solutions with expert insights and AI powered tools for academic success
Step: 2

Step: 3

Ace Your Homework with AI
Get the answers you need in no time with our AI-driven, step-by-step assistance
Get Started


