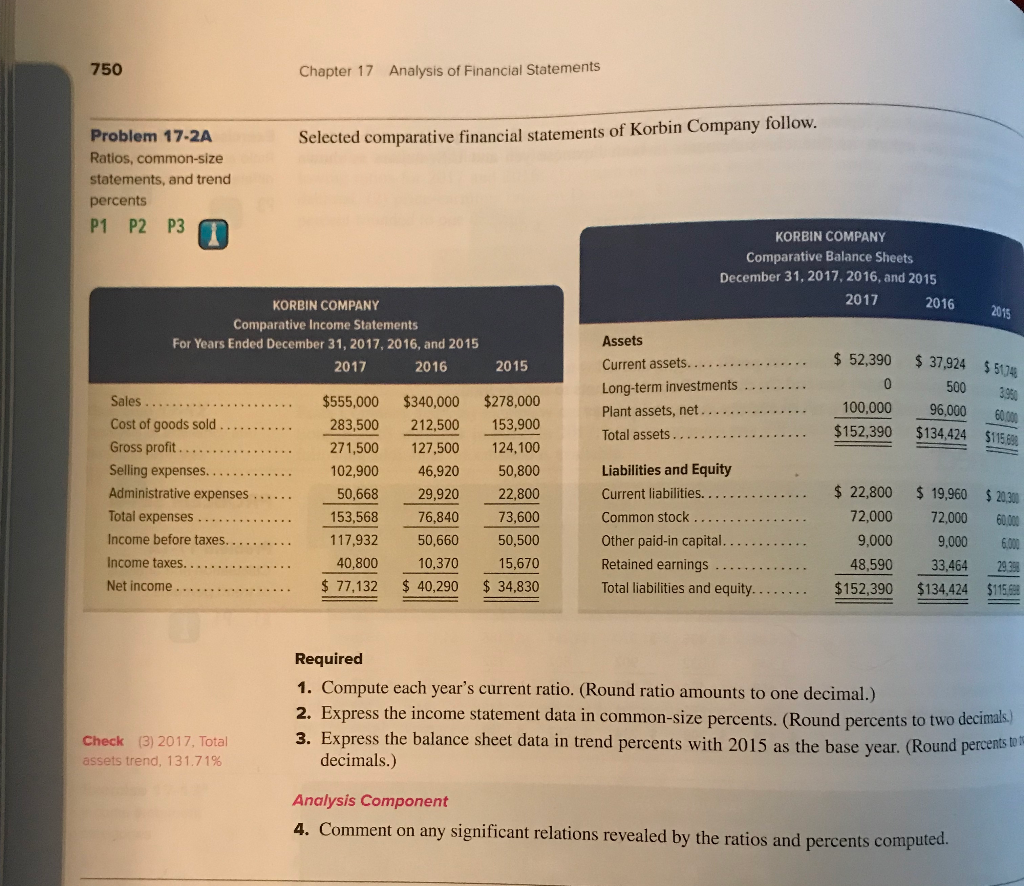
750 Chapter 17 Analysis of Financial Statements Problem 17-2A Ratios, common-size statements, and trend percents P1 P2 P3 Selected comparative financial statements of Korbin Company follow. KORBIN COMPANY Comparative Balance Sheets December 31, 2017, 2016, and 2015 2017 KORBIN COMPANY Comparative Income Statements For Years Ended December 31, 2017, 2016, and 2015 2015 Assets Current assets.. 52,390 $ 37924 $ 5 2017 2016 2015 500 3950 Sales ..._._._.. Cost of goods sold Gross profit $555,000 $340,000 $278,000 283,500 212.500 153,900 271,500 127,500 124,100 02,900 46,920 50,800 29,920 22,800 153,56876,84073,600 117,932 50,660 50,500 10,370 15,670 100,000 96000 0 $152,390 $134,424 $115 6 Total assets Liabilities and Equity s 22,800 $ 19,960 $2030 72,000 72,000 600 9,000 9,000 ,00 48,590 33,464 293 Administrative expenses Total expenses . . 50,6- o, Common stock Income taxes. Retained earnings . . . . Total liabilities and equity . . . $ 77132 540.290 $ 34,830 $1532.30 $44 Required 1. Compute each year's current ratio. (Round ratio amounts to one decimal.) 2. Express the income statement data in common-size percents. (Round percents to two decimals) 3. Express the balance sheet data in trend percents with 2015 as the base year. (Round percents bi Check (3) 2017, Total assets trend, 1 3 1 .71% decimals.) Analysis Component 4. Comment on any significant relations revealed by the ratios and percents computed. 750 Chapter 17 Analysis of Financial Statements Problem 17-2A Ratios, common-size statements, and trend percents P1 P2 P3 Selected comparative financial statements of Korbin Company follow. KORBIN COMPANY Comparative Balance Sheets December 31, 2017, 2016, and 2015 2017 KORBIN COMPANY Comparative Income Statements For Years Ended December 31, 2017, 2016, and 2015 2015 Assets Current assets.. 52,390 $ 37924 $ 5 2017 2016 2015 500 3950 Sales ..._._._.. Cost of goods sold Gross profit $555,000 $340,000 $278,000 283,500 212.500 153,900 271,500 127,500 124,100 02,900 46,920 50,800 29,920 22,800 153,56876,84073,600 117,932 50,660 50,500 10,370 15,670 100,000 96000 0 $152,390 $134,424 $115 6 Total assets Liabilities and Equity s 22,800 $ 19,960 $2030 72,000 72,000 600 9,000 9,000 ,00 48,590 33,464 293 Administrative expenses Total expenses . . 50,6- o, Common stock Income taxes. Retained earnings . . . . Total liabilities and equity . . . $ 77132 540.290 $ 34,830 $1532.30 $44 Required 1. Compute each year's current ratio. (Round ratio amounts to one decimal.) 2. Express the income statement data in common-size percents. (Round percents to two decimals) 3. Express the balance sheet data in trend percents with 2015 as the base year. (Round percents bi Check (3) 2017, Total assets trend, 1 3 1 .71% decimals.) Analysis Component 4. Comment on any significant relations revealed by the ratios and percents computed