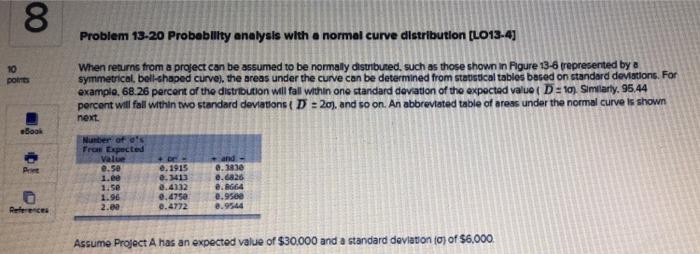
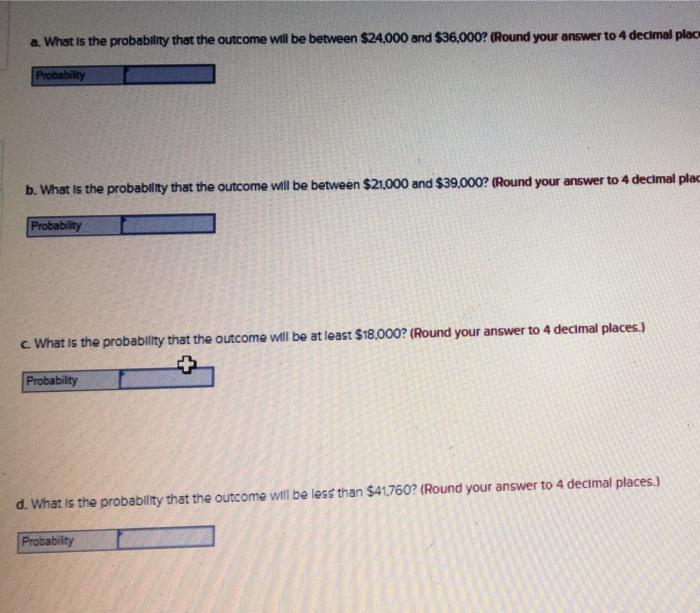
8 10 points Book Priet References Problem 13-20 Probability analysis with a normal curve distribution [LO13-4] When returns from a project can be assumed to be normally distributed, such as those shown in Figure 13-6 (represented by a symmetrical, bell-shaped curve), the areas under the curve can be determined from statistical tables based on standard deviations. For example, 68.26 percent of the distribution will fall within one standard deviation of the expected value ( D=10) Similarly, 95.44 percent will fall within two standard deviations (D = 20), and so on. An abbreviated table of areas under the normal curve is shown next. Number of o's From Expected Value 0.50 + Dr and 6.1915 0.3830 1.00 0.3413 0.6826 1.50 0.4332 8.8664 1.96 0.4750 0.9500 2.00 0.4772 8.9544 Assume Project A has an expected value of $30.000 and a standard deviation (a) of $6,000. a. What is the probability that the outcome will be between $24,000 and $36,000? (Round your answer to 4 decimal place Probability b. What is the probability that the outcome will be between $21,000 and $39,000? (Round your answer to 4 decimal plac Probability c. What is the probability that the outcome will be at least $18,000? (Round your answer to 4 decimal places.) Probability d. What is the probability that the outcome will be less than $41,760? (Round your answer to 4 decimal places.) Probability e. What is the probability that the outcome will be less than $27,000 or greater than $39,000? (Round your answer to 4 decimal places) Probability 8 10 points Book Priet References Problem 13-20 Probability analysis with a normal curve distribution [LO13-4] When returns from a project can be assumed to be normally distributed, such as those shown in Figure 13-6 (represented by a symmetrical, bell-shaped curve), the areas under the curve can be determined from statistical tables based on standard deviations. For example, 68.26 percent of the distribution will fall within one standard deviation of the expected value ( D=10) Similarly, 95.44 percent will fall within two standard deviations (D = 20), and so on. An abbreviated table of areas under the normal curve is shown next. Number of o's From Expected Value 0.50 + Dr and 6.1915 0.3830 1.00 0.3413 0.6826 1.50 0.4332 8.8664 1.96 0.4750 0.9500 2.00 0.4772 8.9544 Assume Project A has an expected value of $30.000 and a standard deviation (a) of $6,000. a. What is the probability that the outcome will be between $24,000 and $36,000? (Round your answer to 4 decimal place Probability b. What is the probability that the outcome will be between $21,000 and $39,000? (Round your answer to 4 decimal plac Probability c. What is the probability that the outcome will be at least $18,000? (Round your answer to 4 decimal places.) Probability d. What is the probability that the outcome will be less than $41,760? (Round your answer to 4 decimal places.) Probability e. What is the probability that the outcome will be less than $27,000 or greater than $39,000? (Round your answer to 4 decimal places) Probability