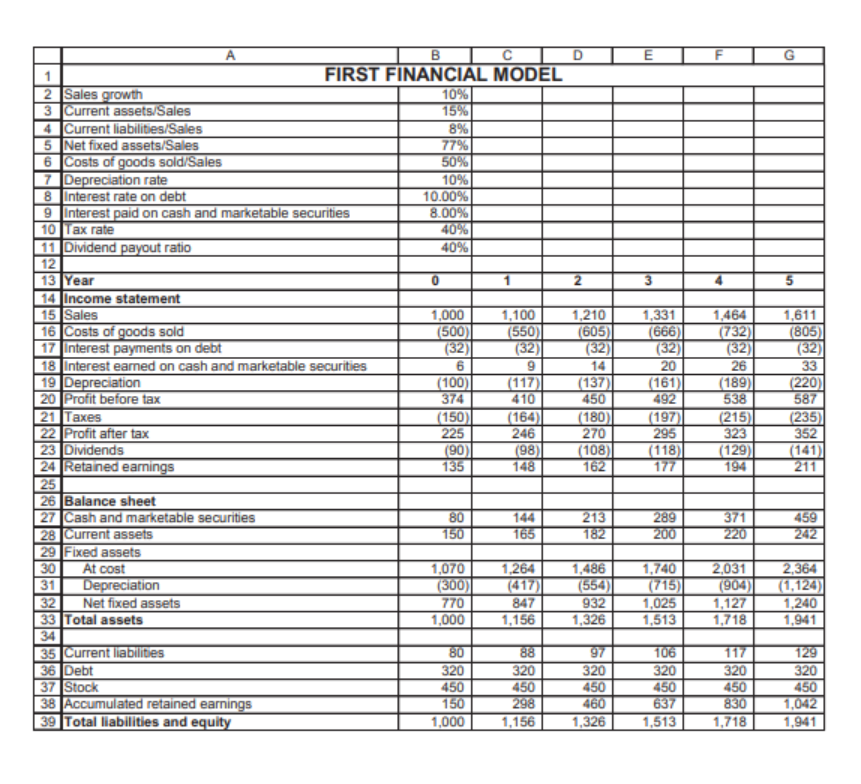
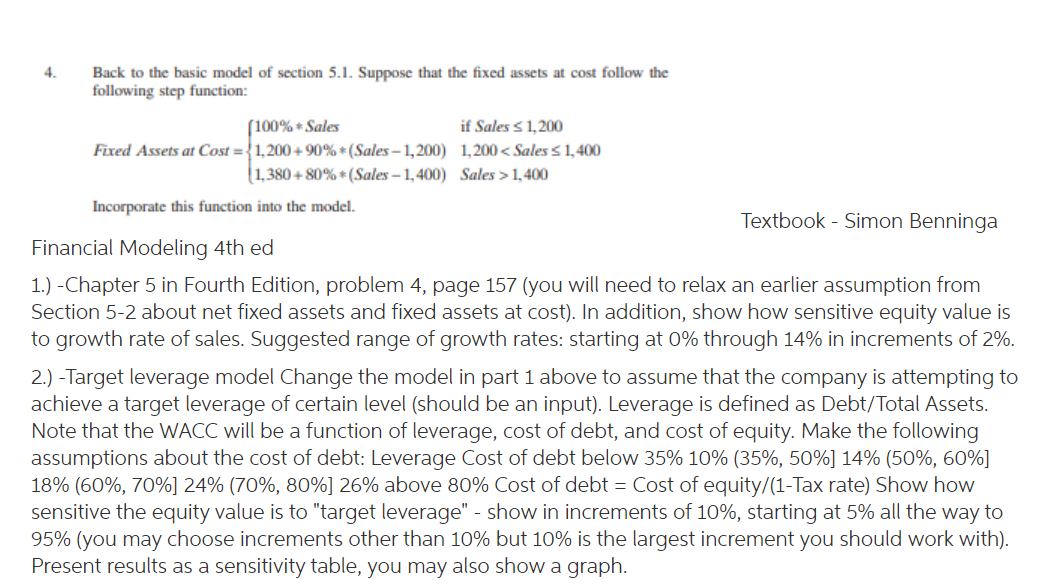
8% 3 5 B TC 1 FIRST FINANCIAL MODEL 2 Sales growth 10% 3 Current assets/Sales 15% 4 Current liabilities/Sales 5 Net fixed assets/Sales 77% 6 Costs of goods sold/Sales 50% 7 Depreciation rate 10% 8 Interest rate on debt 10.00% 9 Interest paid on cash and marketable securities 8.00% 10 Tax rate 40% 11 Dividend payout ratio 40% 12 13 Year 0 1 2 14 Income statement 15 Sales 1,000 1,100 1,210 16 Costs of goods sold (500) (550) (605) 17 Interest payments on debt (32) (32) (32) 18 Interest eamed on cash and marketable securities 6 9 14 19 Depreciation (100) (117) (137) 20 Profit before tax 374 410 450 21 Taxes (150 (164) (180) 22 Profit after tax 225 246 270 23 Dividends (90) (98) (108) 24 Retained earnings 135 148 162 25 26 Balance sheet 27 Cash and marketable securities 80 144 213 28 Current assets 150 165 182 29 Fixed assets 30 At cost 1,070 1,264 31 Depreciation (300) (554) 32 Net fixed assets 770 847 932 33 Total assets 1,000 1,156 1,326 34 35 Current liabilities 80 88 97 36 Debt 320 320 320 37 Stock 450 450 450 38 Accumulated retained earnings 150 298 460 39 Total liabilities and equity 1,000 1,156 1,326 1,331 (666) (32) 20 (161) 1,464 (732) (32) 26 (189) 538 (215) 323 (129) 194 1,611 (805) (32) 33 (220) 587 (235) 352 (141) 211 492 (197 295 (118) 177 289 200 371 220 459 242 1,486 1,740 (715) 1,025 1,513 2,031 (9041 1,127 1,718 2,364 (1,124) 1,240 1,941 106 320 450 637 1,513 117 320 450 830 1,718 129 320 450 1,042 1,941 4. Back to the basic model of section 5.1. Suppose that the fixed assets at cost follow the following step function: (100%*Sales if Sales S 1.200 Fixed Assets at Cost = {1,200 + 90%*(Sales - 1,200) 1,200 1,400 Incorporate this function into the model. Textbook - Simon Benninga Financial Modeling 4th ed 1.) -Chapter 5 in Fourth Edition, problem 4, page 157 (you will need to relax an earlier assumption from Section 5-2 about net fixed assets and fixed assets at cost). In addition, show how sensitive equity value is to growth rate of sales. Suggested range of growth rates: starting at 0% through 14% in increments of 2%. 2.) -Target leverage model Change the model in part 1 above to assume that the company is attempting to achieve a target leverage of certain level (should be an input). Leverage is defined as Debt/Total Assets. Note that the WACC will be a function of leverage, cost of debt, and cost of equity. Make the following assumptions about the cost of debt: Leverage Cost of debt below 35% 10% (35%, 50%] 14% (50%, 60%] 18% (60%, 70%] 24% (70%, 80%] 26% above 80% Cost of debt = Cost of equity/(1-Tax rate) Show how sensitive the equity value is to "target leverage" - show in increments of 10%, starting at 5% all the way to 95% (you may choose increments other than 10% but 10% is the largest increment you should work with). Present results as a sensitivity table, you may also show a graph. 8% 3 5 B TC 1 FIRST FINANCIAL MODEL 2 Sales growth 10% 3 Current assets/Sales 15% 4 Current liabilities/Sales 5 Net fixed assets/Sales 77% 6 Costs of goods sold/Sales 50% 7 Depreciation rate 10% 8 Interest rate on debt 10.00% 9 Interest paid on cash and marketable securities 8.00% 10 Tax rate 40% 11 Dividend payout ratio 40% 12 13 Year 0 1 2 14 Income statement 15 Sales 1,000 1,100 1,210 16 Costs of goods sold (500) (550) (605) 17 Interest payments on debt (32) (32) (32) 18 Interest eamed on cash and marketable securities 6 9 14 19 Depreciation (100) (117) (137) 20 Profit before tax 374 410 450 21 Taxes (150 (164) (180) 22 Profit after tax 225 246 270 23 Dividends (90) (98) (108) 24 Retained earnings 135 148 162 25 26 Balance sheet 27 Cash and marketable securities 80 144 213 28 Current assets 150 165 182 29 Fixed assets 30 At cost 1,070 1,264 31 Depreciation (300) (554) 32 Net fixed assets 770 847 932 33 Total assets 1,000 1,156 1,326 34 35 Current liabilities 80 88 97 36 Debt 320 320 320 37 Stock 450 450 450 38 Accumulated retained earnings 150 298 460 39 Total liabilities and equity 1,000 1,156 1,326 1,331 (666) (32) 20 (161) 1,464 (732) (32) 26 (189) 538 (215) 323 (129) 194 1,611 (805) (32) 33 (220) 587 (235) 352 (141) 211 492 (197 295 (118) 177 289 200 371 220 459 242 1,486 1,740 (715) 1,025 1,513 2,031 (9041 1,127 1,718 2,364 (1,124) 1,240 1,941 106 320 450 637 1,513 117 320 450 830 1,718 129 320 450 1,042 1,941 4. Back to the basic model of section 5.1. Suppose that the fixed assets at cost follow the following step function: (100%*Sales if Sales S 1.200 Fixed Assets at Cost = {1,200 + 90%*(Sales - 1,200) 1,200 1,400 Incorporate this function into the model. Textbook - Simon Benninga Financial Modeling 4th ed 1.) -Chapter 5 in Fourth Edition, problem 4, page 157 (you will need to relax an earlier assumption from Section 5-2 about net fixed assets and fixed assets at cost). In addition, show how sensitive equity value is to growth rate of sales. Suggested range of growth rates: starting at 0% through 14% in increments of 2%. 2.) -Target leverage model Change the model in part 1 above to assume that the company is attempting to achieve a target leverage of certain level (should be an input). Leverage is defined as Debt/Total Assets. Note that the WACC will be a function of leverage, cost of debt, and cost of equity. Make the following assumptions about the cost of debt: Leverage Cost of debt below 35% 10% (35%, 50%] 14% (50%, 60%] 18% (60%, 70%] 24% (70%, 80%] 26% above 80% Cost of debt = Cost of equity/(1-Tax rate) Show how sensitive the equity value is to "target leverage" - show in increments of 10%, starting at 5% all the way to 95% (you may choose increments other than 10% but 10% is the largest increment you should work with). Present results as a sensitivity table, you may also show a graph