8. A research result on the unvaccinated children in a certain state showed that the rate of unvaccinated was 12%. If we let Y be
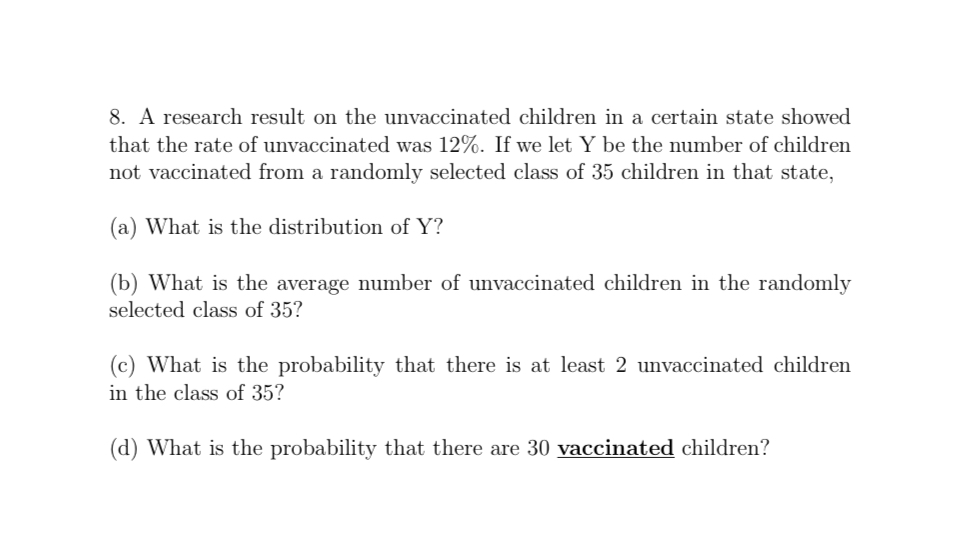
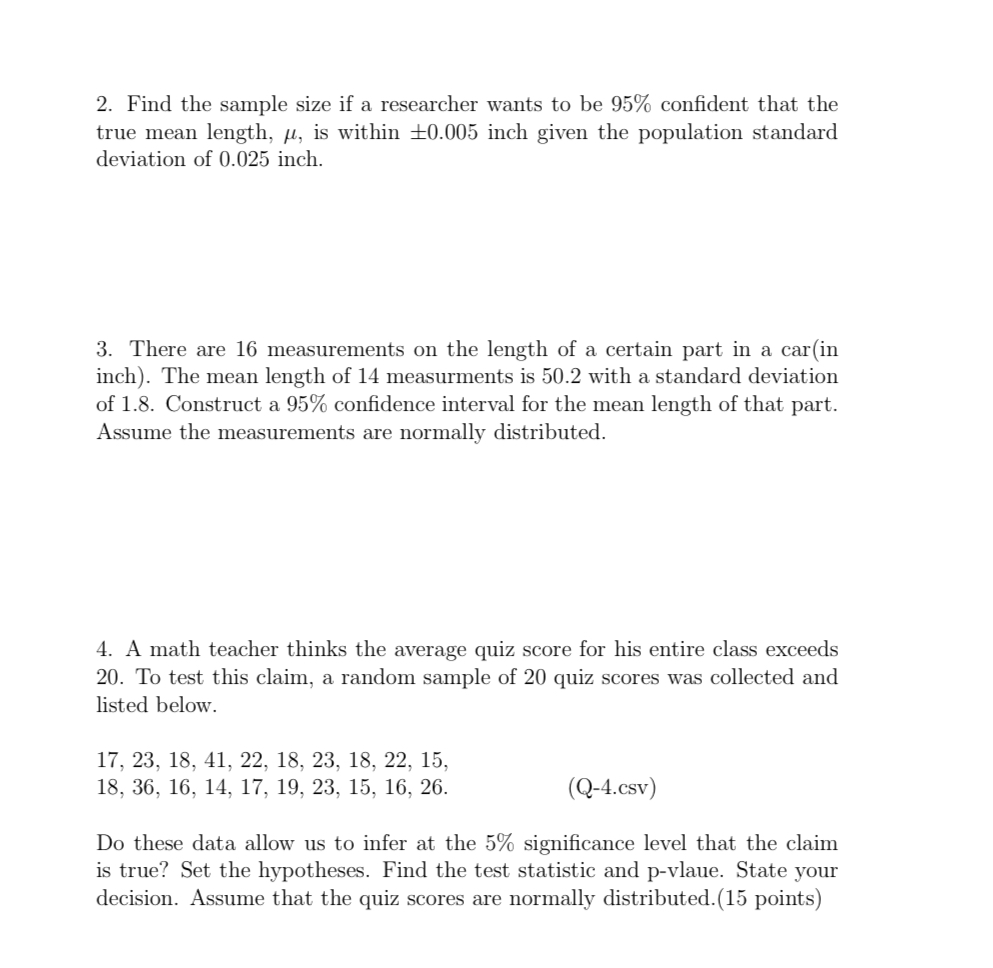
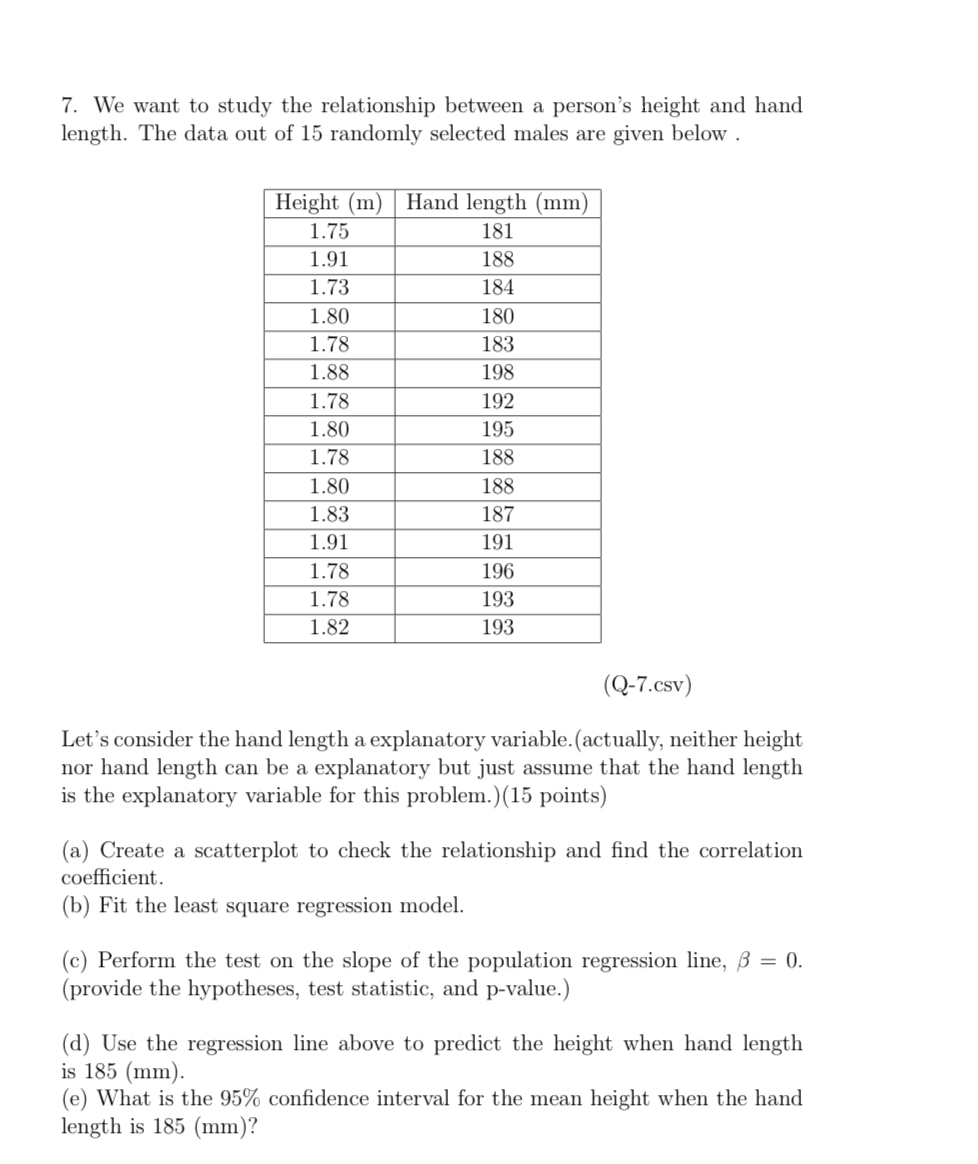
8. A research result on the unvaccinated children in a certain state showed that the rate of unvaccinated was 12%. If we let Y be the number of children not vaccinated from a randomly selected class of 35 children in that state, (a) What is the distribution of Y? (b) What is the average number of unvaccinated children in the randomly selected class of 35? (c) What is the probability that there is at least 2 unvaccinated children in the class of 35'? (d) What is the probability that there are 30 vaccinated children? 2. Find the sample size if a researcher wants to be 95% condent that the true mean length, 11., is within i inch given the population standard deviation of 0.025 inch. 3. There are 15 measurements on the length of a certain part in a car(in inch). The mean length of 14 measurments is 50.2 with a standard deviation of 1.8. Construct a 95% condence interval for the mean length of that part. Assume the measurements are normally distributed. 4. A math teacher thinks the average quiz score for his entire class exceeds 20. To test this claim, a random sample of 20 quiz scores was collected and listed below. 17, 23, 13, 41, 22, 18, 23, 13, 22, 15, 18, 35, 15, 14, 17, 19, 23, 15, 16, 26. (Q-4.csv) Do these data allow us to infer at the 5% signicance level that the claim is true? Set the hypotheses. Find the test statistic and p-vlaue. State your decision. Assume that the quiz scores are normally distributed.(15 points) 7. We want to study the relationship between a person's height and hand length. The data out of 15 randomly selected males are given below . Height (m) Hand length (mm) 1.75 181 1.91 188 1.73 184 1.80 180 1.78 183 1.88 198 1.78 192 1.80 195 1.78 188 1.80 188 1.83 187 1.91 191 1.78 196 1.78 193 1.82 193 (Q-7.csv) Let's consider the hand length a explanatory variable. (actually, neither height nor hand length can be a explanatory but just assume that the hand length is the explanatory variable for this problem. ) (15 points) (a) Create a scatterplot to check the relationship and find the correlation coefficient. (b) Fit the least square regression model. (c) Perform the test on the slope of the population regression line, B = 0. (provide the hypotheses, test statistic, and p-value.) (d) Use the regression line above to predict the height when hand length is 185 (mm). (e) What is the 95% confidence interval for the mean height when the hand length is 185 (mm)?1. The heights of a random sample of 81 female undergraduate students at a certain college is provided below. 54, 54, 56, 57, 58, 58, 58, 58, 59, 60, 60, 60, 60, 60, 60, 60,61, 61, 61, 61, 61, 61,61, 61, 62,62, 62, 62,62, 62,62, 62, 62,63, 63, 63, 63,63, 63,63, 63, 63,63, 63, 63,64, 64,64, 64, 64,64, 64, 64, 64,64, 64,64, 64, 64,64, 65, 65,65, 65,65, 65, 65,65, 66, 66, 66,66, 66, 67, 67, 67, 67, 68, 68,68, 70. (Q-1.csv) Assume that the heights in the population are normally distributed with standard deviation 0' = 3 inches Do the data provide evidence that the mean height of all female undergraduate students in a certain college is dif- ferent from the mean height of 63.5 inches of all female in the population? Answer the questions below.(15 points) (a) Set the hypotheses. (b) Calculate the test statistic. (c) Find the p-value. (d) State your decision on H0 at the signicance level of 0.05. (e) What is your conclusion? 5. There are two methods to finish a job. A manager wants to know if using Method 2 saves more time than using Method 1. For each method, 25 work- ers are randomly selected and time to finish the job was measured in hours. The time to finish a job follows normal distribution for each method(assume the variances are different). Method 1 : 6.8, 5.0, 7.9, 5.2, 7.6, 5.0, 5.9, 5.2, 6.5, 7.4, 6.1, 6.2, 7.1, 4.6, 6.0, 7.1, 6.1, 5.0, 6.3, 7.0, 6.4, 6.1, 6.6, 7.7, 6.4. Method 2 : 5.2, 6.0, 5.7, 6.6, 6.5, 6.5, 5.9, 6.2, 6.1, 4.2, 4.2, 4.5, 5.3, 7.0, 7.0, 5.9, 7.1, 5.2, 7.0, 5.7, 5.9, 4.9, 5.0, 4.2, 7.1. (Q-5.csv) Use a = 0.05 for your decision. (provide the hypotheses, test statistic, de- grees of freedom, and p-value.) (15 points) 6. There are three different types of treatment on a certain disease. The data below are from 438 randomly assigned patients to one of three treatments. Success means no more symptoms at the end of the study period. Treatments A B C Success 32 15 18 Failure 115 130 128 Is there significant evidence that the three treatments perform differently? (provide the hypotheses, test statistic, degrees of freedom, and p-value.) Use a = 0.05
Step by Step Solution
There are 3 Steps involved in it
Step: 1
Get Instant Access to Expert-Tailored Solutions
See step-by-step solutions with expert insights and AI powered tools for academic success
Step: 2
Step: 3
Ace Your Homework with AI
Get the answers you need in no time with our AI-driven, step-by-step assistance