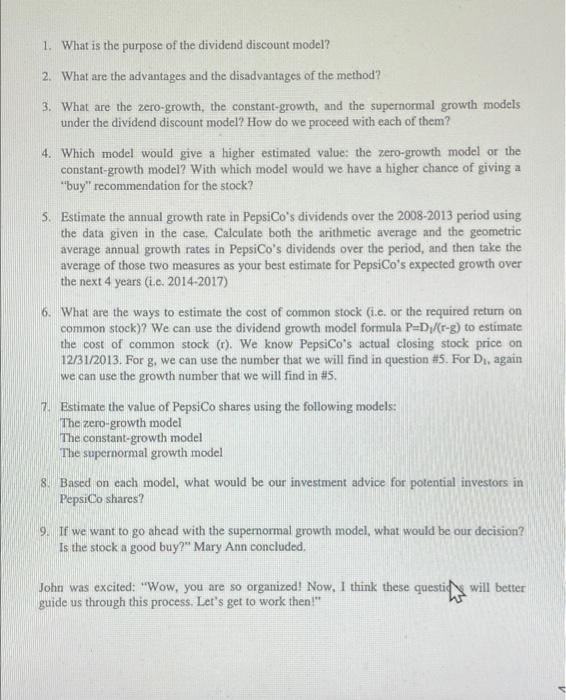
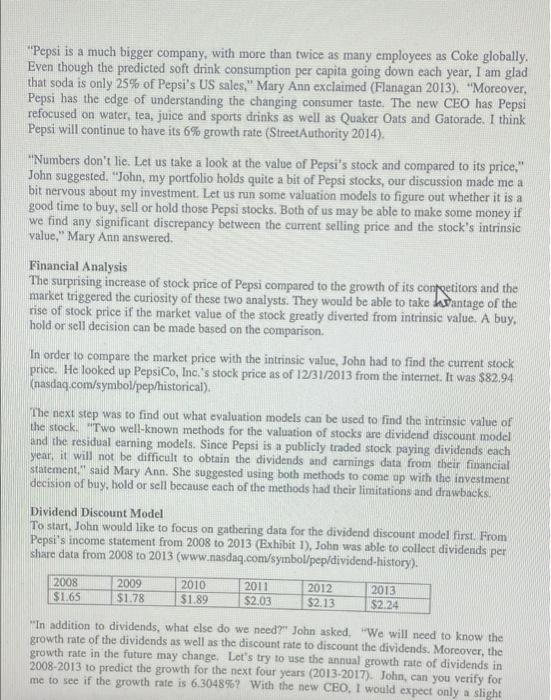
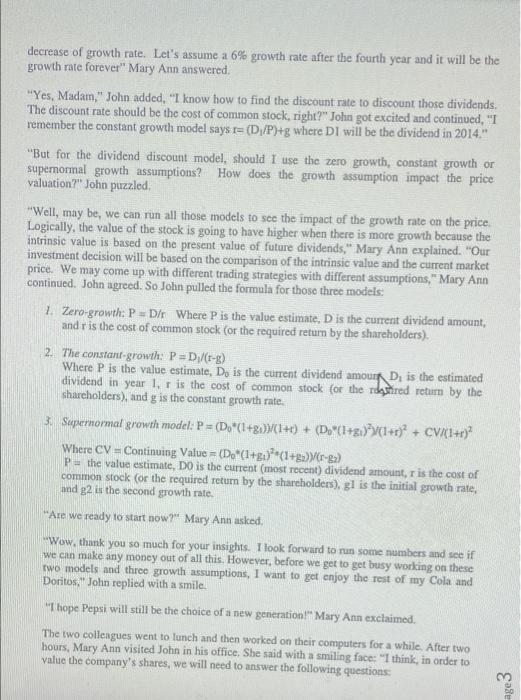
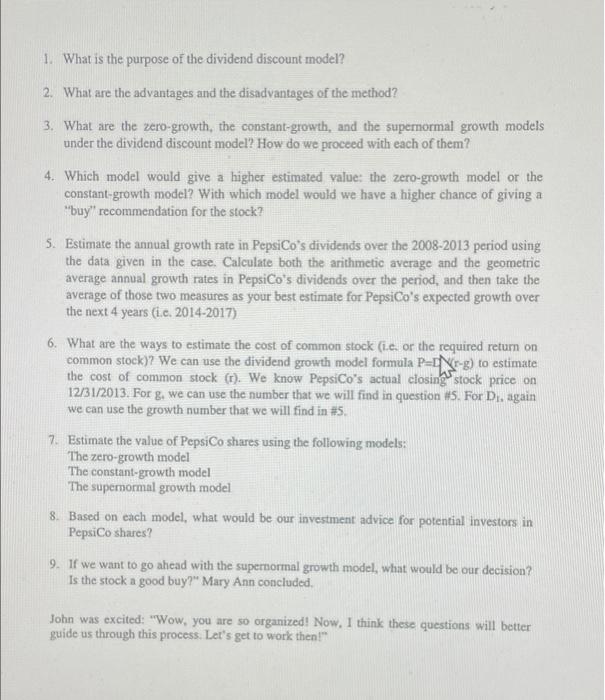
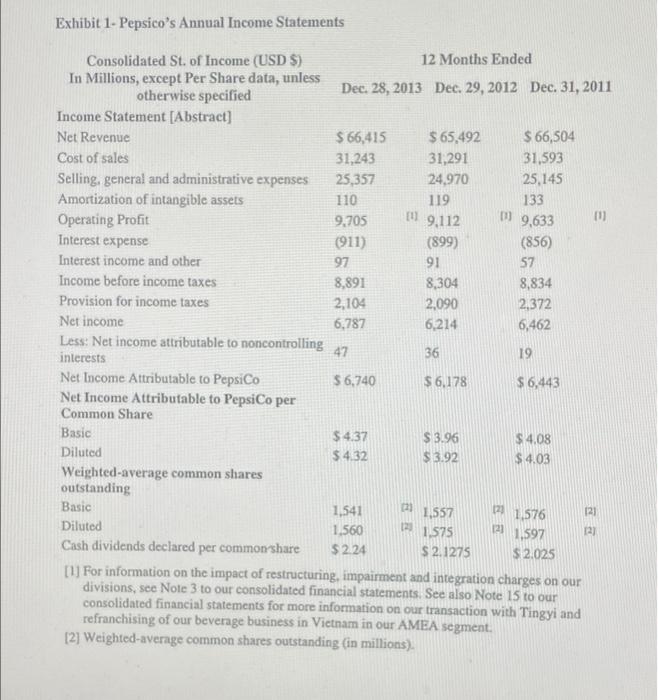
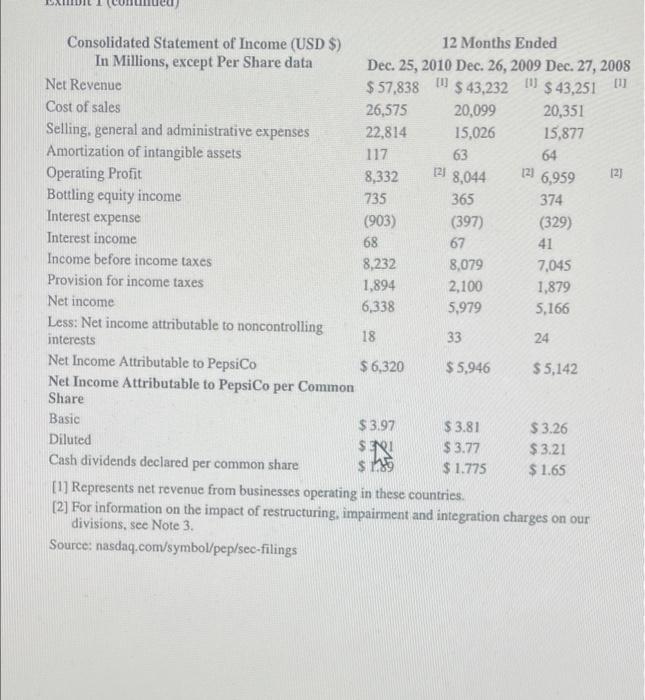
1. What is the purpose of the dividend discount model? 2. What are the advantages and the disadvantages of the method? 3. What are the zero-growth, the constant-growth, and the superormal growth models under the dividend discount model? How do we proceed with each of them? 4. Which model would give a higher estimated value the zero-growth model or the constant-growth model? With which model would we have a higher chance of giving a "buy" recommendation for the stock? 5. Estimate the annual growth rate in PepsiCo's dividends over the 2008-2013 period using the data given in the case, Calculate both the arithmetic average and the geometric average annual growth rates in PepsiCo's dividends over the period, and then take the average of those two measures as your best estimate for PepsiCo's expected growth over the next 4 years (i.e. 2014-2017) 6. What are the ways to estimate the cost of common stock (1.c. or the required return on common stock)? We can use the dividend growth model formula P=D/(r-g) to estimate the cost of common stock (r). We know PepsiCo's actual closing stock price on 12/31/2013. For g. we can use the number that we will find in question #5. For Di, again we can use the growth number that we will find in #. 7. Estimate the value of PepsiCo shares using the following models: The zero-growth model The constant-growth model The supernormal growth model 8. Based on each model, what would be our investment advice for potential investors in PepsiCo shares? 9. If we want to go ahead with the supernormal growth model, what would be our decision? Is the stock a good buy?" Mary Ann concluded, John was excited: "Wow, you are so organized! Now, I think these questid will better guide us through this process. Let's get to work then!" Case study DDM Using the Dividend Discount Model in Valuation: The Case of PepsiCo Introduction John was a newly hired security analyst of AJJ Minnesota Investment Company. His job was to evaluate financial securities based on asset pricing models and fundamental analysis. He worked with portfolio managers to support their buy, hold or sell decisions on financial securities. It was 2:30p.m. in the afternoon; John really needed some boost after the long meeting with his clients. Headed towards the staff's lounge, he was looking forward to grab his favorite Coca Cola. To his disappointment, he found the whole refrigerator was filled with low calories, healthy drinks. As he pushed through those low sodium V8, Naked Juice, Gatorade and La Croix Sparkling Water with natural favors, he managed to find a can of Pepsi Cola at the back of the rack. Fierce Competition While John was indulging in his favorite Doritos, his Pepsi rival, Mary Ann, walked in Mary Ann was a senior security analyst, and she was a devoted Pepsi fan "Hi Polar bear, I am glad that you finally take the Pepsi Challenge! Be young, have fun and drink Pepsi," said Mary Ann John replied, "Nothing can beat the real thing." The decade old cola war has a new front. Those healthy products, that are occupying our fridge right now, are pushing down the demand for carbonated soft drinks. It went from 46 to 38 gallons per capita in the past 10 years. May be it's time to re-evaluate your Pepsi stocks." John added (StreetAuthority 2014) John continued: "Have you noticed the sudden increase in PepsiCo's shares from February to November 2014? It jumped from a low of $78.09 on February 10, 2014 to $100.10 on November 24, 2014. When I checked Coke's shares for the same period, I noticed that there was only a 7% increase in Coke shares. It was $88.42 on March 9 and later it went up to only $94.56 on November 24. The S&P500 ETF went up by only 10%, from 188 26 to 207 20" "Pepsi is a much bigger company, with more than twice as many employees as Coke globally, Even though the predicted soft drink consumption per capita going down each year, I am glad that soda is only 25% of Pepsi's US sales," Mary Ann exclaimed (Flanagan 2013). "Moreover, Pepsi has the edge of understanding the changing consumer taste. The new CEO has Pepsi refocused on water, tea, juice and sports drinks as well as Quaker Oats and Gatorade. I think Pepsi will continue to have its 6% growth rate (StreetAuthority 2014). "Numbers don't lie. Let us take a look at the value of Pepsi's stock and compared to its price," John suggested. "John, my portfolio holds quite a bit of Pepsi stocks, our discussion made me a bit nervous about my investment. Let us run some valuation models to figure out whether it is a good time to buy, sell or hold those Pepsi stocks. Both of us may be able to make some money if we find any significant discrepancy between the current selling price and the stock's intrinsic value," Mary Ann answered. Financial Analysis The surprising increase of stock price of Pepsi compared to the growth of its contretitors and the market triggered the curiosity of these two analysts. They would be able to take hantage of the rise of stock price if the market value of the stock greatly diverted from intrinsic value. A buy. hold or sell decision can be made based on the comparison In order to compare the market price with the intrinsic value, John had to find the current stock price. He looked up PepsiCo, Inc.'s stock price as of 12/31/2013 from the internet. It was $82,94 (nasdaq.com/symbol/pep/historical). The next step was to find out what evaluation models can be used to find the intrinsic value of the stock. "Two well-known methods for the valuation of stocks are dividend discount model and the residual earning models. Since Pepsi is a publicly traded stock paying dividends each year, it will not be difficult to obtain the dividends and carnings data from their financial statement." said Mary Ann. She suggested using both methods to come up with the investment decision of buy, hold or sell because each of the methods had their limitations and drawbacks Dividend Discount Model To start, John would like to focus on gathering data for the dividend discount model first. From Pepsi's income statement from 2008 to 2013 (Exhibit 1), John was able to collect dividends per share data from 2008 to 2013 (www.nasdaq.com/symbol/pep dividend-history). 2011 2012 $1.65 $1.78 $1.89 $2.03 $2.13 $2.24 2008 2009 2010 2013 "In addition to dividends, what else do we need?" John asked, "We will need to know the growth rate of the dividends as well as the discount rate to discount the dividends. Moreover, the growth rate in the future may change. Let's try to use the annual growth rate of dividends in 2008-2013 to predict the growth for the next four years (2013-2017). John, can you verify for me to see if the growth rate is 6.3048%? With the new CEO, I would expect only a slight decrease of growth rate. Let's assume a 6% growth rate after the fourth year and it will be the growth rate forever" Mary Ann answered. "Yes, Madam," John added, "I know how to find the discount rate to discount those dividends. The discount rate should be the cost of common stock, right?" John got excited and continued. "I remember the constant growth model says r= (D/P)+g where DI will be the dividend in 2014." "But for the dividend discount model, should I use the zero growth, constant growth or superormal growth assumptions? How does the growth assumption impact the price valuation?" John puzzled, "Well, may be, we can run all those models to see the impact of the growth rate on the price Logically, the value of the stock is going to have higher when there is more growth because the intrinsic value is based on the present value of future dividends," Mary Ann explained. "Our investment decision will be based on the comparison of the intrinsic value and the current market price. We may come up with different trading strategies with different assumptions," Mary Ann continued. John ingreed. So John pulled the formula for those three models 1. Zero-growth: P = D/ Where P is the value estimate, D is the current dividend amount, and r is the cost of common stock (or the required return by the shareholders) 2. The constant-growth: P=DM-g) Where P is the value estimate, D, is the current dividend amour D. is the estimated dividend in year lr is the cost of common stock for the rotired return by the shareholders), and g is the constant growth rate. 3. Supernormal growth model: P = (D)*(1+8}}{1+c) + (D."(+8)+r) + CV/(1+r)* Where CV = Continuing Value = (D. *(1+g.)**(1+3)/(r-82) Pthe value estimate, DO is the current (most recent) dividend amount, r is the cost of common stock (or the required return by the shareholders), gl is the initial growth rate, and g2 is the second growth rate "Are we ready to start now?" Mary Ann asked. "Wow, thank you so much for your insights. I look forward to run some numbers and see if we can make any money out of all this. However, before we get to get busy working on these two models and three growth assumptions, I want to get enjoy the rest of my Cola and Doritos: John replied with a smile. "I hope Pepsi will still be the choice of a new generationt" Mary Ann exclaimed. The two colleagues went to lunch and then worked on their computers for a while. After two hours, Mary Ann visited John in his office. She said with a smiling face: "I think, in order to value the company's shares, we will need to answer the following questions 1. What is the purpose of the dividend discount model? 2. What are the advantages and the disadvantages of the method? 3. What are the zero-growth, the constant-growth, and the supernormal growth models under the dividend discount model? How do we proceed with each of them? 4. Which model would give a higher estimated value: the zero-growth model or the constant-growth model? With which model would we have a higher chance of giving a buy recommendation for the stock? 5. Estimate the annual growth rate in PepsiCo's dividends over the 2008-2013 period using the data given in the case. Calculate both the arithmetic average and the geometric average annual growth rates in PepsiCo's dividends over the period, and then take the average of those two measures as your best estimate for PepsiCo's expected growth over the next 4 years (i.c. 2014-2017) 6. What are the ways to estimate the cost of common stock (i.e. or the required return on common stock)? We can use the dividend growth model formula PIN-) to estimate the cost of common stock (r). We know PepsiCo's actual closing stock price on 12/31/2013. For g. we can use the number that we will find in question 5. For D again we can use the growth number that we will find in #5 7. Estimate the value of PepsiCo shares using the following models: The zero-growth model The constant-growth model The superormal growth model 8. Based on each model, what would be our investment advice for potential investors in PepsiCo shares? 9. If we want to go ahead with the supernormal growth model, what would be our decision? Is the stock a good buy?" Mary Ann concluded. John was excited: "Wow, you are so organized! Now, I think these questions will better guide us through this process. Ler's get to work then! Exhibit 1. Pepsico's Annual Income Statements 111 9.112 D 9,633 Consolidated St. of Income (USD $) 12 Months Ended In Millions, except Per Share data, unless otherwise specified Dec. 28, 2013 Dec. 29, 2012 Dec 31, 2011 Income Statement [Abstract] Net Revenue $ 66,415 $ 65,492 $ 66,504 Cost of sales 31,243 31,291 31,593 Selling, general and administrative expenses 25,357 24,970 25,145 Amortization of intangible assets 110 119 133 Operating Profit 9,705 Interest expense (911) (899) (856) Interest income and other 97 91 57 Income before income taxes 8,891 8,304 8,834 Provision for income taxes 2,104 2,090 2,372 Net income 6,787 6,214 6,462 Less: Net income attributable to noncontrolling 36 interests 19 Net Income Attributable to PepsiCo $ 6,740 $6,178 $6,443 Net Income Attributable to PepsiCo per Common Share Basic $ 4.37 $ 3.96 $14.08 Diluted $432 $ 3.92 $ 4.03 Weighted average common shares outstanding Basic 1,541 021 1.557 1,576 Diluted 1.560 1.575 121 1,597 Cash dividends declared per common share $ 2.24 $ 2.1275 $ 2.025 [1] For information on the impact of restructuring, impairment and integration charges on our divisions, see Note 3 to our consolidated financial statements. See also Note 15 to our consolidated financial statements for more information on our transaction with Tingyi and refranchising of our beverage business in Vietnam in our AMEA segment. [2] Weighted average common shares outstanding (in millions). 47 [2] 12) 121 12) Interest expense Consolidated Statement of Income (USD $) 12 Months Ended In Millions, except Per Share data Dec. 25, 2010 Dec. 26, 2009 Dec. 27, 2008 [1] Net Revenue 11 $57,838 $ 43,232 LU $ 43,251 Cost of sales 26,575 20,099 20,351 Selling, general and administrative expenses 22,814 15,026 15,877 Amortization of intangible assets 117 63 64 Operating Profit 8,332 121 8,044 121 6,959 121 Bottling equity income 735 365 374 (903) (397) (329) Interest income 68 67 41 Income before income taxes 8,232 8,079 7,045 Provision for income taxes 1,894 2,100 1,879 Net income 6,338 5,979 5,166 Less: Net income attributable to noncontrolling interests 18 33 24 Net Income Attributable to PepsiCo $ 6,320 $ 5,946 $5,142 Net Income Attributable to PepsiCo per Common Share Basic $ 3.97 $ 3.81 $ 3.26 Diluted $ 3.77 $ 3.21 Cash dividends declared per common share $ 1.775 $ 1.65 [1] Represents net revenue from businesses operating in these countries. [2] For information on the impact of restructuring, impairment and integration charges on our divisions, see Note 3 Source: nasdaq.com/symbol/pep/sec-filings 5.18 $ 15 1. What is the purpose of the dividend discount model? 2. What are the advantages and the disadvantages of the method? 3. What are the zero-growth, the constant-growth, and the superormal growth models under the dividend discount model? How do we proceed with each of them? 4. Which model would give a higher estimated value the zero-growth model or the constant-growth model? With which model would we have a higher chance of giving a "buy" recommendation for the stock? 5. Estimate the annual growth rate in PepsiCo's dividends over the 2008-2013 period using the data given in the case, Calculate both the arithmetic average and the geometric average annual growth rates in PepsiCo's dividends over the period, and then take the average of those two measures as your best estimate for PepsiCo's expected growth over the next 4 years (i.e. 2014-2017) 6. What are the ways to estimate the cost of common stock (1.c. or the required return on common stock)? We can use the dividend growth model formula P=D/(r-g) to estimate the cost of common stock (r). We know PepsiCo's actual closing stock price on 12/31/2013. For g. we can use the number that we will find in question #5. For Di, again we can use the growth number that we will find in #. 7. Estimate the value of PepsiCo shares using the following models: The zero-growth model The constant-growth model The supernormal growth model 8. Based on each model, what would be our investment advice for potential investors in PepsiCo shares? 9. If we want to go ahead with the supernormal growth model, what would be our decision? Is the stock a good buy?" Mary Ann concluded, John was excited: "Wow, you are so organized! Now, I think these questid will better guide us through this process. Let's get to work then!" Case study DDM Using the Dividend Discount Model in Valuation: The Case of PepsiCo Introduction John was a newly hired security analyst of AJJ Minnesota Investment Company. His job was to evaluate financial securities based on asset pricing models and fundamental analysis. He worked with portfolio managers to support their buy, hold or sell decisions on financial securities. It was 2:30p.m. in the afternoon; John really needed some boost after the long meeting with his clients. Headed towards the staff's lounge, he was looking forward to grab his favorite Coca Cola. To his disappointment, he found the whole refrigerator was filled with low calories, healthy drinks. As he pushed through those low sodium V8, Naked Juice, Gatorade and La Croix Sparkling Water with natural favors, he managed to find a can of Pepsi Cola at the back of the rack. Fierce Competition While John was indulging in his favorite Doritos, his Pepsi rival, Mary Ann, walked in Mary Ann was a senior security analyst, and she was a devoted Pepsi fan "Hi Polar bear, I am glad that you finally take the Pepsi Challenge! Be young, have fun and drink Pepsi," said Mary Ann John replied, "Nothing can beat the real thing." The decade old cola war has a new front. Those healthy products, that are occupying our fridge right now, are pushing down the demand for carbonated soft drinks. It went from 46 to 38 gallons per capita in the past 10 years. May be it's time to re-evaluate your Pepsi stocks." John added (StreetAuthority 2014) John continued: "Have you noticed the sudden increase in PepsiCo's shares from February to November 2014? It jumped from a low of $78.09 on February 10, 2014 to $100.10 on November 24, 2014. When I checked Coke's shares for the same period, I noticed that there was only a 7% increase in Coke shares. It was $88.42 on March 9 and later it went up to only $94.56 on November 24. The S&P500 ETF went up by only 10%, from 188 26 to 207 20" "Pepsi is a much bigger company, with more than twice as many employees as Coke globally, Even though the predicted soft drink consumption per capita going down each year, I am glad that soda is only 25% of Pepsi's US sales," Mary Ann exclaimed (Flanagan 2013). "Moreover, Pepsi has the edge of understanding the changing consumer taste. The new CEO has Pepsi refocused on water, tea, juice and sports drinks as well as Quaker Oats and Gatorade. I think Pepsi will continue to have its 6% growth rate (StreetAuthority 2014). "Numbers don't lie. Let us take a look at the value of Pepsi's stock and compared to its price," John suggested. "John, my portfolio holds quite a bit of Pepsi stocks, our discussion made me a bit nervous about my investment. Let us run some valuation models to figure out whether it is a good time to buy, sell or hold those Pepsi stocks. Both of us may be able to make some money if we find any significant discrepancy between the current selling price and the stock's intrinsic value," Mary Ann answered. Financial Analysis The surprising increase of stock price of Pepsi compared to the growth of its contretitors and the market triggered the curiosity of these two analysts. They would be able to take hantage of the rise of stock price if the market value of the stock greatly diverted from intrinsic value. A buy. hold or sell decision can be made based on the comparison In order to compare the market price with the intrinsic value, John had to find the current stock price. He looked up PepsiCo, Inc.'s stock price as of 12/31/2013 from the internet. It was $82,94 (nasdaq.com/symbol/pep/historical). The next step was to find out what evaluation models can be used to find the intrinsic value of the stock. "Two well-known methods for the valuation of stocks are dividend discount model and the residual earning models. Since Pepsi is a publicly traded stock paying dividends each year, it will not be difficult to obtain the dividends and carnings data from their financial statement." said Mary Ann. She suggested using both methods to come up with the investment decision of buy, hold or sell because each of the methods had their limitations and drawbacks Dividend Discount Model To start, John would like to focus on gathering data for the dividend discount model first. From Pepsi's income statement from 2008 to 2013 (Exhibit 1), John was able to collect dividends per share data from 2008 to 2013 (www.nasdaq.com/symbol/pep dividend-history). 2011 2012 $1.65 $1.78 $1.89 $2.03 $2.13 $2.24 2008 2009 2010 2013 "In addition to dividends, what else do we need?" John asked, "We will need to know the growth rate of the dividends as well as the discount rate to discount the dividends. Moreover, the growth rate in the future may change. Let's try to use the annual growth rate of dividends in 2008-2013 to predict the growth for the next four years (2013-2017). John, can you verify for me to see if the growth rate is 6.3048%? With the new CEO, I would expect only a slight decrease of growth rate. Let's assume a 6% growth rate after the fourth year and it will be the growth rate forever" Mary Ann answered. "Yes, Madam," John added, "I know how to find the discount rate to discount those dividends. The discount rate should be the cost of common stock, right?" John got excited and continued. "I remember the constant growth model says r= (D/P)+g where DI will be the dividend in 2014." "But for the dividend discount model, should I use the zero growth, constant growth or superormal growth assumptions? How does the growth assumption impact the price valuation?" John puzzled, "Well, may be, we can run all those models to see the impact of the growth rate on the price Logically, the value of the stock is going to have higher when there is more growth because the intrinsic value is based on the present value of future dividends," Mary Ann explained. "Our investment decision will be based on the comparison of the intrinsic value and the current market price. We may come up with different trading strategies with different assumptions," Mary Ann continued. John ingreed. So John pulled the formula for those three models 1. Zero-growth: P = D/ Where P is the value estimate, D is the current dividend amount, and r is the cost of common stock (or the required return by the shareholders) 2. The constant-growth: P=DM-g) Where P is the value estimate, D, is the current dividend amour D. is the estimated dividend in year lr is the cost of common stock for the rotired return by the shareholders), and g is the constant growth rate. 3. Supernormal growth model: P = (D)*(1+8}}{1+c) + (D."(+8)+r) + CV/(1+r)* Where CV = Continuing Value = (D. *(1+g.)**(1+3)/(r-82) Pthe value estimate, DO is the current (most recent) dividend amount, r is the cost of common stock (or the required return by the shareholders), gl is the initial growth rate, and g2 is the second growth rate "Are we ready to start now?" Mary Ann asked. "Wow, thank you so much for your insights. I look forward to run some numbers and see if we can make any money out of all this. However, before we get to get busy working on these two models and three growth assumptions, I want to get enjoy the rest of my Cola and Doritos: John replied with a smile. "I hope Pepsi will still be the choice of a new generationt" Mary Ann exclaimed. The two colleagues went to lunch and then worked on their computers for a while. After two hours, Mary Ann visited John in his office. She said with a smiling face: "I think, in order to value the company's shares, we will need to answer the following questions 1. What is the purpose of the dividend discount model? 2. What are the advantages and the disadvantages of the method? 3. What are the zero-growth, the constant-growth, and the supernormal growth models under the dividend discount model? How do we proceed with each of them? 4. Which model would give a higher estimated value: the zero-growth model or the constant-growth model? With which model would we have a higher chance of giving a buy recommendation for the stock? 5. Estimate the annual growth rate in PepsiCo's dividends over the 2008-2013 period using the data given in the case. Calculate both the arithmetic average and the geometric average annual growth rates in PepsiCo's dividends over the period, and then take the average of those two measures as your best estimate for PepsiCo's expected growth over the next 4 years (i.c. 2014-2017) 6. What are the ways to estimate the cost of common stock (i.e. or the required return on common stock)? We can use the dividend growth model formula PIN-) to estimate the cost of common stock (r). We know PepsiCo's actual closing stock price on 12/31/2013. For g. we can use the number that we will find in question 5. For D again we can use the growth number that we will find in #5 7. Estimate the value of PepsiCo shares using the following models: The zero-growth model The constant-growth model The superormal growth model 8. Based on each model, what would be our investment advice for potential investors in PepsiCo shares? 9. If we want to go ahead with the supernormal growth model, what would be our decision? Is the stock a good buy?" Mary Ann concluded. John was excited: "Wow, you are so organized! Now, I think these questions will better guide us through this process. Ler's get to work then! Exhibit 1. Pepsico's Annual Income Statements 111 9.112 D 9,633 Consolidated St. of Income (USD $) 12 Months Ended In Millions, except Per Share data, unless otherwise specified Dec. 28, 2013 Dec. 29, 2012 Dec 31, 2011 Income Statement [Abstract] Net Revenue $ 66,415 $ 65,492 $ 66,504 Cost of sales 31,243 31,291 31,593 Selling, general and administrative expenses 25,357 24,970 25,145 Amortization of intangible assets 110 119 133 Operating Profit 9,705 Interest expense (911) (899) (856) Interest income and other 97 91 57 Income before income taxes 8,891 8,304 8,834 Provision for income taxes 2,104 2,090 2,372 Net income 6,787 6,214 6,462 Less: Net income attributable to noncontrolling 36 interests 19 Net Income Attributable to PepsiCo $ 6,740 $6,178 $6,443 Net Income Attributable to PepsiCo per Common Share Basic $ 4.37 $ 3.96 $14.08 Diluted $432 $ 3.92 $ 4.03 Weighted average common shares outstanding Basic 1,541 021 1.557 1,576 Diluted 1.560 1.575 121 1,597 Cash dividends declared per common share $ 2.24 $ 2.1275 $ 2.025 [1] For information on the impact of restructuring, impairment and integration charges on our divisions, see Note 3 to our consolidated financial statements. See also Note 15 to our consolidated financial statements for more information on our transaction with Tingyi and refranchising of our beverage business in Vietnam in our AMEA segment. [2] Weighted average common shares outstanding (in millions). 47 [2] 12) 121 12) Interest expense Consolidated Statement of Income (USD $) 12 Months Ended In Millions, except Per Share data Dec. 25, 2010 Dec. 26, 2009 Dec. 27, 2008 [1] Net Revenue 11 $57,838 $ 43,232 LU $ 43,251 Cost of sales 26,575 20,099 20,351 Selling, general and administrative expenses 22,814 15,026 15,877 Amortization of intangible assets 117 63 64 Operating Profit 8,332 121 8,044 121 6,959 121 Bottling equity income 735 365 374 (903) (397) (329) Interest income 68 67 41 Income before income taxes 8,232 8,079 7,045 Provision for income taxes 1,894 2,100 1,879 Net income 6,338 5,979 5,166 Less: Net income attributable to noncontrolling interests 18 33 24 Net Income Attributable to PepsiCo $ 6,320 $ 5,946 $5,142 Net Income Attributable to PepsiCo per Common Share Basic $ 3.97 $ 3.81 $ 3.26 Diluted $ 3.77 $ 3.21 Cash dividends declared per common share $ 1.775 $ 1.65 [1] Represents net revenue from businesses operating in these countries. [2] For information on the impact of restructuring, impairment and integration charges on our divisions, see Note 3 Source: nasdaq.com/symbol/pep/sec-filings 5.18 $ 15