Answered step by step
Verified Expert Solution
Link Copied!

Question

1 Approved Answer

8) Assume for an identical project done by four teams have produced the following graph sets. 1 2 3 4 5 6 1 3 9

image text in transcribedimage text in transcribed
8) Assume for an identical project done by four teams have produced the following graph sets. 1 2 3 4 5 6 1 3 9 30 1 12 13 14 85 16 17 38 19 20 How are each of the projects doing? Which graphs support each conclusion? Budget Cost of Work Scheduled [weekly) Planned valve 74 1XX 186 200 383 200 185 84 132 88 30 10 15 30 BCWS Manroc Val V 4 223 435 615 803 2304 1392 1206 1385 1437 1537 15:7 1554 2584 1590 1580 1560 Planned Comolee PV/ BAY 986 34% 26% 2045 51% @24 758 805 Actual Cost of Work Performed Tweeily Actuel Cost 91 212 173 144 273 156 134 3608 1 2 3 4 5 6 7 8 9 20 11 12 13 14 6 16 17 38 9 2 ACUP 612 1545 1564 1582 1838 Budget Cost of Work Scheduled Budget Cost of Work Performed [weekly) Planned Value Planned Vel PV 34 203 435 615 808 3204 1383 1236 1205 1439 3537 1519 1354 2304 1890 1530 1930 1930 1530 Actual % Complete Schedule Planned'S Comolese PV/ BAC SK. 343 26% 2083 51 805 758 80% Exred Value EV 27.7 3067 2434 5247 7513 20817 13517 2131.3 13127 13832 1419 Performance Indexes Actual Cost of Work Performed weekly Actuel Cost 68 17 108 218 134 382 175 85 25 67 45 10 11 Schedule Performance Inder SP1 0.64 0.91 1.00 915 085 100 157 1.95 0.95 0 94 0.93 053 0.52 0.93 195 Actuel Cos INC 63 206 443 612 215 3098 1273 1358 3457 1548 2529 1939 1610 3851 185 Cost: Performance Inder CP1 0.52 0.68 0.87 0.15 015 0.95 1.58 0.95 096 834 052 0.98 1.91 0.93 192 8.94 0.52 9.39 053 091 Budget Cost of Work Performed stimates Actual % Complete |Schedule 7 15% 22% 31% 27% 57% 71% 17% 87% 90% 95% 25% 57% 1018 Estimate At Completion CAC 15:3 30 1686 30 2652 6 3565 30 1719 80 2617.30 1611.30 1648.79 3842.30 1571.70 1726.94 176400 1721 00 1718.30 1715 30 134261 173290 1717.80 1717.80 174700 BCUP Earned Value EV 1041 138 0 356.6 1914.8 934.4 843.7 10214 1436.7 13723 34362 15071 15181 1530 8 25300 1580 1830.0 2590.0 19504 1530.0 25910 To Complete Performance Inden WC.P 103 109 1.06 1.I Performance Indexes Progress Measurs Schedule Performance Inder SP1 140 105 0.86 0.30 0.74 0.85 1.95 0.95 0.95 097 095 0.59 1.39 100 200 100 160 180 1.80 100 Actual-Planned Y Complete Cos: Performance Indied J3 071 189 150 091 093 095 495 195 096 195 195 095 496 056 098 HEAD COUNT Estimates Planned Head Count Estimate At Completion ERKC 1558 80 1957.75 267584 1781 95 1841 12 189 16 1715 50 1731 35 1734.45 1958. 36 167207 1571.26 1850 95 0658.35 1358 39 1658.35 1658 35 1658 76 1658 39 3658 35 Actual Head Hound to Complete Performance Inder W.M 094 101 1.08 1.21 129 157 140 101 201 837 9242 -7.34 -234 006 190 600 0404 480 084 60 234 639 521 434 872 470 404 381 2.8 301 181 639 057 284 133 Progress Measurs Actual- Planned 16 complete HEAD COUNT Plarred Head Count 234 458 567 613 567 613 567 254 3.36 268 151 131 048 186 Actual Head Hound 214 537 596 1.18 403 851 527 2.56 2.98 267 135 630 0.32 195 Level Of Effort 1800.00 Planned Value PV Earned Value EV 1750.00 -- - Actus Cost AC 1700.00 Level Of Effort Level Of Effort 1900.00 10 11 12 13 14 15 16 17 18 19 20 1650 .00 -Planned Value PV 1850 00 . Earned Value EV 1800 00 Index SPI 1800.00 -- - Actual Cost AC 1750 00 Performance Index CPI 1550.00 -Extimate At Complemtion EAC el Of Effort 8 9 10 11 12 13 14 15 16 17 18 19 20 1650 00 Performance Index OCT COST 1600 00 12 3 4 5 6 7 8 9 10 11 12 13 14 15 16 17 ".Schedule Performance Index SDI 1550.00 -Cost Performance Index CPI 0% 1450.0 Estimate At Complemtion EAC 34 58 7 8 9 10 11 12 13 14 15 16 17/18 19 20 1400.00 NZ- Performance Index 1 2 3 4 5 6 7 8 9 10 11 12 13 14 15 16 17 18 19 20 2 3 4 5 6 7 8 9 10 14 12 13 14 15 16 17 18 19 20 & Planned Head Count -4% % Ahead or Behind Schedule Actual Head Hount 12 3 4 3 10 11 12 13 14 15 16 17 15 19 20 1 2 3 4 5 6 7 8 9 10 24 24 15 14 15 16 17 18 19 20 Head Count $5 Planned Head Count % Ahead or Behind Schedule Actual Heed Hount -Actual - Planned 5% Complete Head Count -42% -Actual - Planned % Complete 1 2 3 4 5 6 7 8 9 10 11 12 13 14 15 16 17 18 19 20 1 2 3 4 5 6 7 8 9 10 11 12 13 14 15 16 17 18 19 20Week 1 2 3 4 5 6 7 Budget Cost of Work Scheduled [weekly) Planned Value 14 152 30 260 358 230 18 8 1 2 3 4 5 6 7 3 9 20 11 12 13 14 6 16 17 38 19 20 Planned Value DV 34 223 435 615 808 1304 1930 1206 1385 Budget Cost of Work Scheduled Planned % Complese PV/ BAC 58 34% 26x 3915 51x 21%% 75% 80 [weekly) Planned Value 4 152 108 209 368 230 185 84 132 85 Actual Cost of Work Performed Manned Val WV 34 223 435 615 809 3204 1283 1206 1385 1437 telly Actuel Cost 212 380 286 140 256 258 268 81 162 6 Planned% Complene PV/ BAC 586 34% 26% 3946 519 60%% 751 8036 875 935 Actuel Cos AC 302 280 475 619 717 1345 1314 1357 1565 Actual Cost of Work Performed Budget Cost of Work Performed |weekly Actuel Cost 91 241 256 142 205 148 158 84 130 29 ACUP Actuel Cos AC 51 190 441 583 793 940 1098 2152 1323 1431 3479 1488 1508 1545 156 Actuel % Complete Schedule Exred Value EV 40.7 1749 365.7 536.1 906 3 2043.4 1297.5 1729.2 25632 1950 1530.0 Budget Cost of Work Performed Performance Indexes Actuel % Complete /Schedule Exmed Value EV 32.8 174.9 3180 2925 639.5 8009 Schedule Performance Inder SP1 0.64 0.77 0.38 103 1.13 106 108 130 1.12 108 104 101 1.12 100 Performance Indexes Cost Performance Inder CP1 0.47 6.62 0.78 103 147 100 198 1.00 180 102 109 180 1.12 102 102 Schedule Performance Inden SP1 041 0.17 0.7 9.80 079 0.81 Estimates Cost Performance Ider CP1 0.61 1.92 0.72 0.85 0.81 0.86 LO Estimate At Completion BAC 1504.30 1836.10 2723.30 1573 80 1450.30 2585.80 161610 153780 2:90.80 1539 80 195906 156300 1958 00 2596.00 2563.30 1535 1 195301 2358 80 1535 00 2593 00 Estimates toComplete Performance Inder 1CP1 104 106 1.10 0.96 084 0.98 105 0.99 108 0.00 0.00 0.0 0.10 0.06 100 Estimate At Completion BAC 1508 30 160619 271304 3580 20 1746.80 172910 171810 1706.80 275130 1713 30 1723 Progress Measurs a Complete Performance Inder 1.P1 101 101 1.11 105 1.21 1.20 1.26 1.38 18 Activel- Planned 1% Complex Progress Measurs HEAD COUNT Actual-Planned % Complete Planned Head Count HEAD COUNT Actual Head Hound 347 545 590 432 476 417 811 23 438 Planned Head Count 234 458 567 6.03 567 603 567 230 Actual Head Hour 154 422 758 43 630 485 471 24 352 260 205 627 068 134 058 495 472 1.20 13 1800 1600 Level Of Effort 1750.00 Planned Value PV Level Of Effort 1700.00 . Earned Value EV - Planned Value PV 1800.00 - - - Actual Cost AC 1650.00 .Earned Value EV 1750.00 1600.00 - - - Actual Cost AC 1700 00 8 9 10 11 12 13 14 15 16 17 18 19 20 1550.00 1500.00 10 11 42 13 14 15 16 17 18 19 20 Level Of Effort 1650 00 Level Of E Schedule Performance Index SPI 1450.00 .Schedule Performance index SDI 1600.00 Cost Performance Index CPI 1400.DO Cost Performance Index CPI 1530.00 1350.0 1300.00 Estimate At Complemtion CAC Performance Index Performance Index TITT 1500.00 1 2 3 4 5 6 7 8 9 10 11 12 13 14 15 16 17 18 19 20 1 2 3 4 5 6 7 8 9 10 11 12 13 14 15 16 17 18 19 20 12% AA -2% 123 4 5 5 16 17 18 19 20 3 4 5 6 7 8 9 10 14 12 13 14 15 16 17 18 19 20 1 2 3 4 5 6 7 8 9 10 11 12 13 14 15 16 17 18 19 20 Planned Head Count H Planned Head Count % Ahead or Behind Schedule % Ahead or Behind Schedule Actual Head Hount Actual Mead Mount -1254 Head Count Head Count 12 3/4 5 6 7 8 9 10 11 12 13 14 15 16 17 18 19 20 -1696 -Actual - Planned % Complete 1 2 3 4 5 6 7 8 9 10 41 12 13 14 15 16 17 18 19 20 1 2 3 4 5 6 7 8 9 10 11 12 13 14 15 16 17 18 19 20

Step by Step Solution

There are 3 Steps involved in it

Step: 1

blur-text-image

Get Instant Access to Expert-Tailored Solutions

See step-by-step solutions with expert insights and AI powered tools for academic success

Step: 2

blur-text-image

Step: 3

blur-text-image

Ace Your Homework with AI

Get the answers you need in no time with our AI-driven, step-by-step assistance

Get Started

Recommended Textbook for

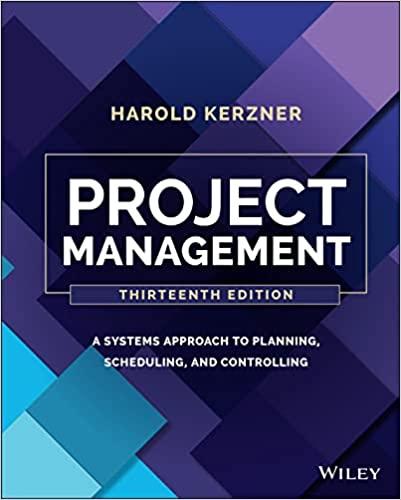
Project Management A Systems Approach To Planning Scheduling And Controlling

Authors: Harold Kerzner

13th Edition

1119805376, 978-1119805373

More Books

Students also viewed these General Management questions

Question

What reward policy would you suggest to the university?

Answered: 1 week ago