

Question: 8. Below is a regression table that shows variables that may predict teacher satisfaction (Olsen & Huang, 2019). Table 2 Mobilesed Models Predicting Teacher Satisfaction
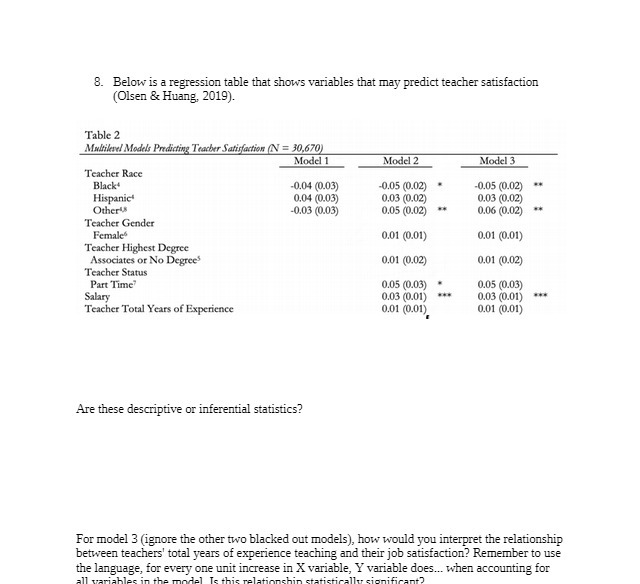
8. Below is a regression table that shows variables that may predict teacher satisfaction (Olsen & Huang, 2019). Table 2 Mobilesed Models Predicting Teacher Satisfaction (N = 30.670) Model 1 Model 2 Model 3 Teacher Race Black 0.04 (0.03) 0.05 (0.02) 0.05 (0.02) Hispanic' 0.04 (0.03) 0.03 (0.02) 0.03 (0.02) Other -0.03 (0.03) 0.05 (0.02) 0.06 (0.02) Teacher Gender Female' 0.01 (0.01) 0.01 (0.01) Teacher Highest Degree Associates or No Degrees 0.01 (0.02) 0.01 (0.02) Teacher Status Part Time 0.05 (0.03) 0.05 (0.03) Salary 0.03 (0.01) 0.03 (0.01) Teacher Total Years of Experience 0.01 (0.01) 0.01 (0.01) Are these descriptive or inferential statistics? For model 3 (ignore the other two blacked out models), how would you interpret the relationship between teachers' total years of experience teaching and their job satisfaction? Remember to use the language, for every one unit increase in X variable, Y variable does... when accounting for
Step by Step Solution
There are 3 Steps involved in it

Get step-by-step solutions from verified subject matter experts