

Answered step by step
Verified Expert Solution
Question
1 Approved Answer
8 . - The Bureau of Labor Statistics publishes data on weekly earnings of full - time wage and salary worke in Employment and Earnings.
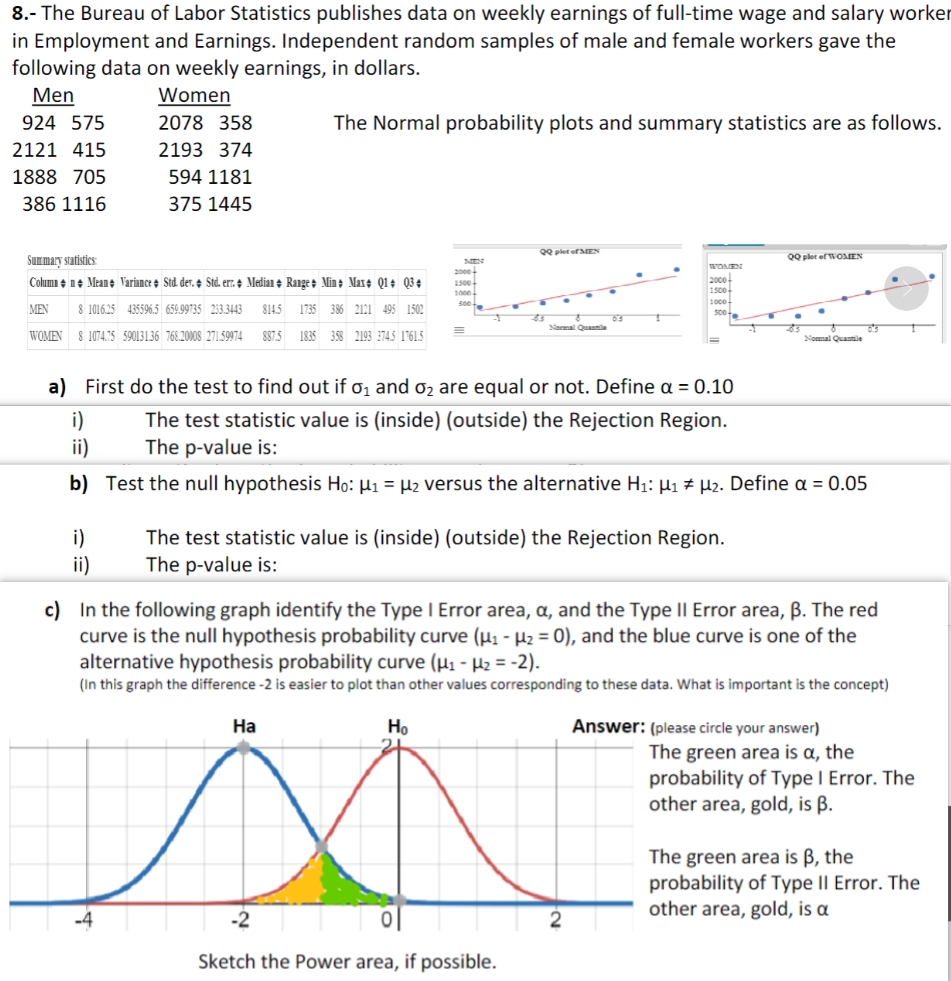
The Bureau of Labor Statistics publishes data on weekly earnings of fulltime wage and salary worke
in Employment and Earnings. Independent random samples of male and female workers gave the
following data on weekly earnings, in dollars.
The Normal probability plots and summary statistics are as follows.
a First do the test to find out if and are equal or not. Define
i The test statistic value is insideoutside the Rejection Region.
ii The value is:
b Test the null hypothesis : versus the alternative : Define
i The test statistic value is insideoutside the Rejection Region.
ii The pvalue is:
c In the following graph identify the Type I Error area, and the Type II Error area, The red
curve is the null hypothesis probability curve and the blue curve is one of the
alternative hypothesis probability curve
In this graph the difference is easier to plot than other values corresponding to these data. What is important is the concept
: please circle your answer
The green area is the
probability of Type I Error. The
other area, gold, is
The green area is the
probability of Type II Error. The
other area, gold, is
Step by Step Solution
There are 3 Steps involved in it
Step: 1

Get Instant Access to Expert-Tailored Solutions
See step-by-step solutions with expert insights and AI powered tools for academic success
Step: 2

Step: 3
Ace Your Homework with AI
Get the answers you need in no time with our AI-driven, step-by-step assistance
Get Started
Calculus Of A Single Variable
Authors: Ron Larson, Bruce H. Edwards
11th Edition
978-1337275361, 9781337275361