Answered step by step
Verified Expert Solution
Question
1 Approved Answer
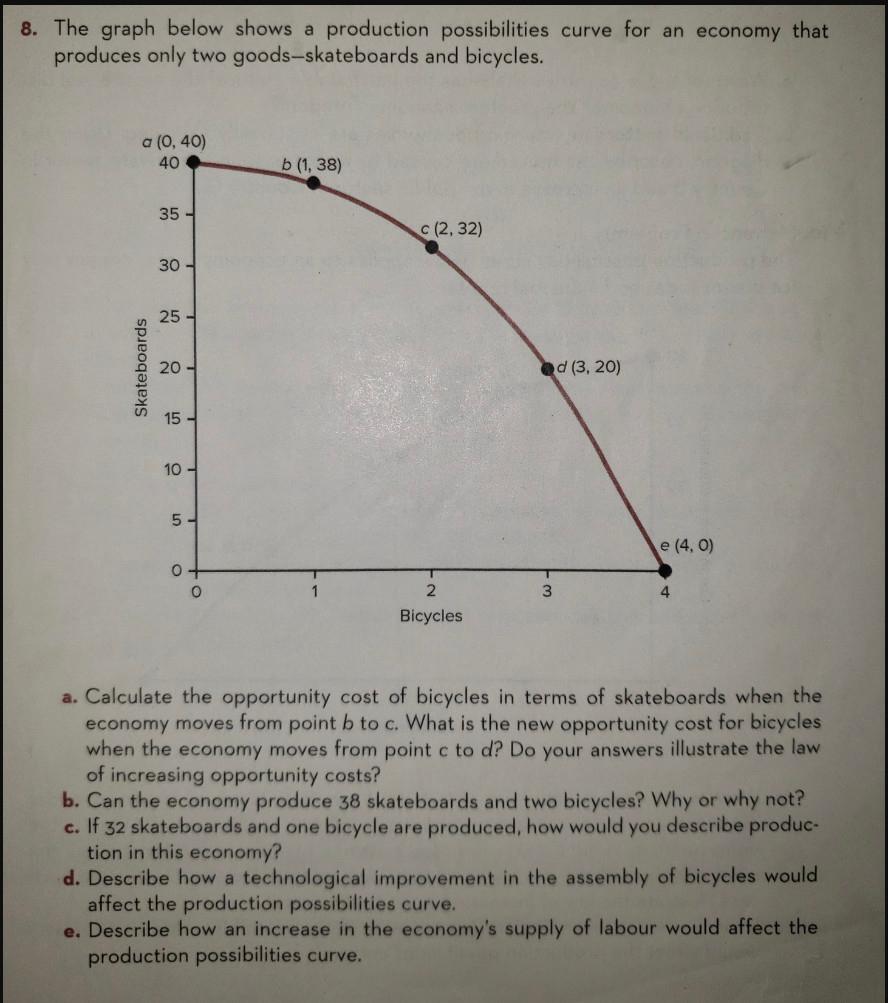
8. The graph below shows a production possibilities curve for an economy that produces only two goods-skateboards and bicycles. a (0,40) 40 Skateboards 35-

8. The graph below shows a production possibilities curve for an economy that produces only two goods-skateboards and bicycles. a (0,40) 40 Skateboards 35- 30- 25- 20- 15- 10- 5- 0 O b (1, 38) c (2, 32) 2 Bicycles ed (3, 20) 3 e (4,0) 4 a. Calculate the opportunity cost of bicycles in terms of skateboards when the economy moves from point b to c. What is the new opportunity cost for bicycles when the economy moves from point c to d? Do your answers illustrate the law of increasing opportunity costs? b. Can the economy produce 38 skateboards and two bicycles? Why or why not? c. If 32 skateboards and one bicycle are produced, how would you describe produc- tion in this economy? d. Describe how a technological improvement in the assembly of bicycles would affect the production possibilities curve. e. Describe how an increase in the economy's supply of labour would affect the production possibilities curve.
Step by Step Solution
There are 3 Steps involved in it
Step: 1
a To calculate the opportunity cost of bicycles in terms of skateboards we need to determine how many skateboards must be given up to produce one addi...
Get Instant Access to Expert-Tailored Solutions
See step-by-step solutions with expert insights and AI powered tools for academic success
Step: 2

Step: 3

Ace Your Homework with AI
Get the answers you need in no time with our AI-driven, step-by-step assistance
Get Started


