Answered step by step
Verified Expert Solution
Link Copied!

Question

1 Approved Answer

8. The table shows employment data for Canadian manufacturing. A scatter plot and residual plot has been created for you on the next page. Note
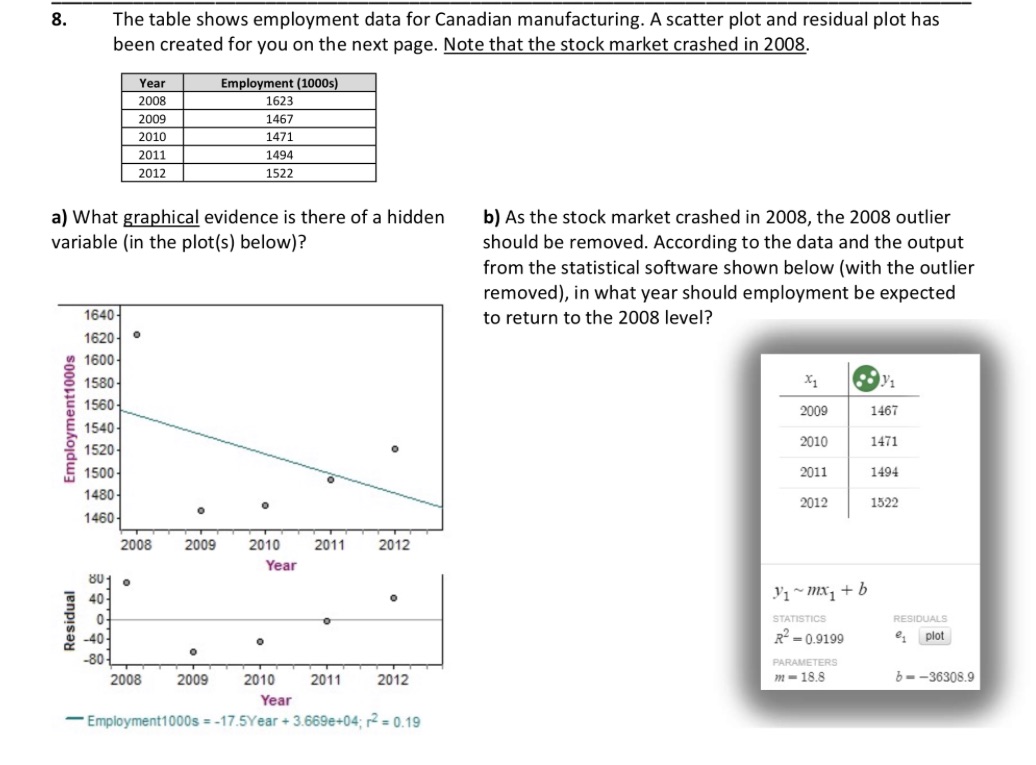
image text in transcribed
8. The table shows employment data for Canadian manufacturing. A scatter plot and residual plot has been created for you on the next page. Note that the stock market crashed in 2008, Year Employment (1000s) 2008 1623 2009 1467 2010 1471 2011 1494 2012 1522 a) What graphical evidence is there of a hidden b) As the stock market crashed in 2008, the 2008 outlier variable (in the plot(s) below)? should be removed. According to the data and the output from the statistical software shown below (with the outlier removed), in what year should employment be expected 1640- to return to the 2008 level? 1620 1600 1580 X1 1560 2009 1467 Employment1000s 2010 1471 2011 1494 2012 1522 1460 2008 2009 2010 2011 2012 Year V1~ mx+ b STATISTICS RESIDUALS Residual R- = 0.9199 21 plot PARAMETERS 2008 2009 2010 2011 2012 IM - 18.8 b- -36308.9 Year - Employment1000s = -17.5Year + 3.669e+04; r2 = 0.19

Step by Step Solution

There are 3 Steps involved in it

Step: 1

blur-text-image

Get Instant Access to Expert-Tailored Solutions

See step-by-step solutions with expert insights and AI powered tools for academic success

Step: 2

blur-text-image

Step: 3

blur-text-image

Ace Your Homework with AI

Get the answers you need in no time with our AI-driven, step-by-step assistance

Get Started

Recommended Textbook for

Beginning Algebra A Text/Workbook

Authors: Charles P McKeague

2nd Edition

1483271242, 9781483271248

More Books

Students also viewed these Mathematics questions

Question

d. Who are important leaders and heroes of the group?

Answered: 1 week ago