

Answered step by step
Verified Expert Solution
Question
1 Approved Answer
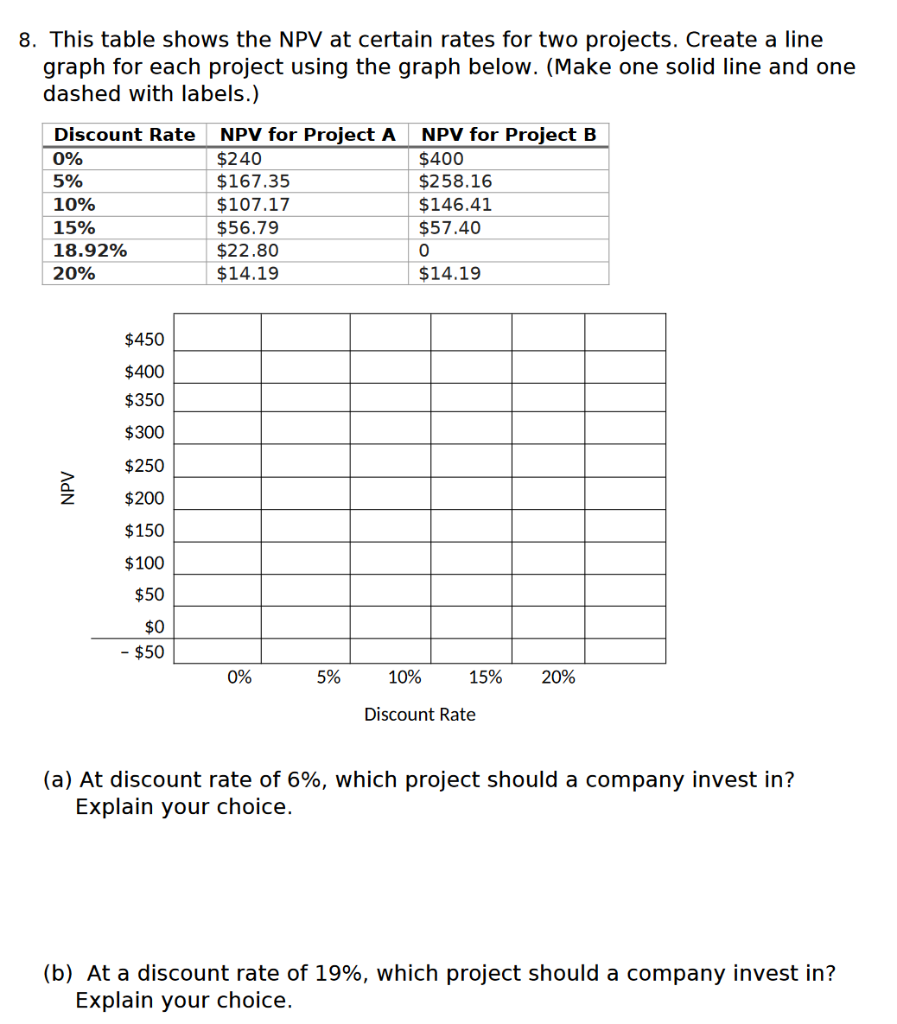
8. This table shows the NPV at certain rates for two projects. Create a line graph for each project using the graph below. (Make one
Step by Step Solution
There are 3 Steps involved in it
Step: 1

Get Instant Access to Expert-Tailored Solutions
See step-by-step solutions with expert insights and AI powered tools for academic success
Step: 2

Step: 3
Ace Your Homework with AI
Get the answers you need in no time with our AI-driven, step-by-step assistance
Get Started
Asia Bond Monitor June 2016
Authors: Asian Development Bank
1st Edition
9292574930,9292574949