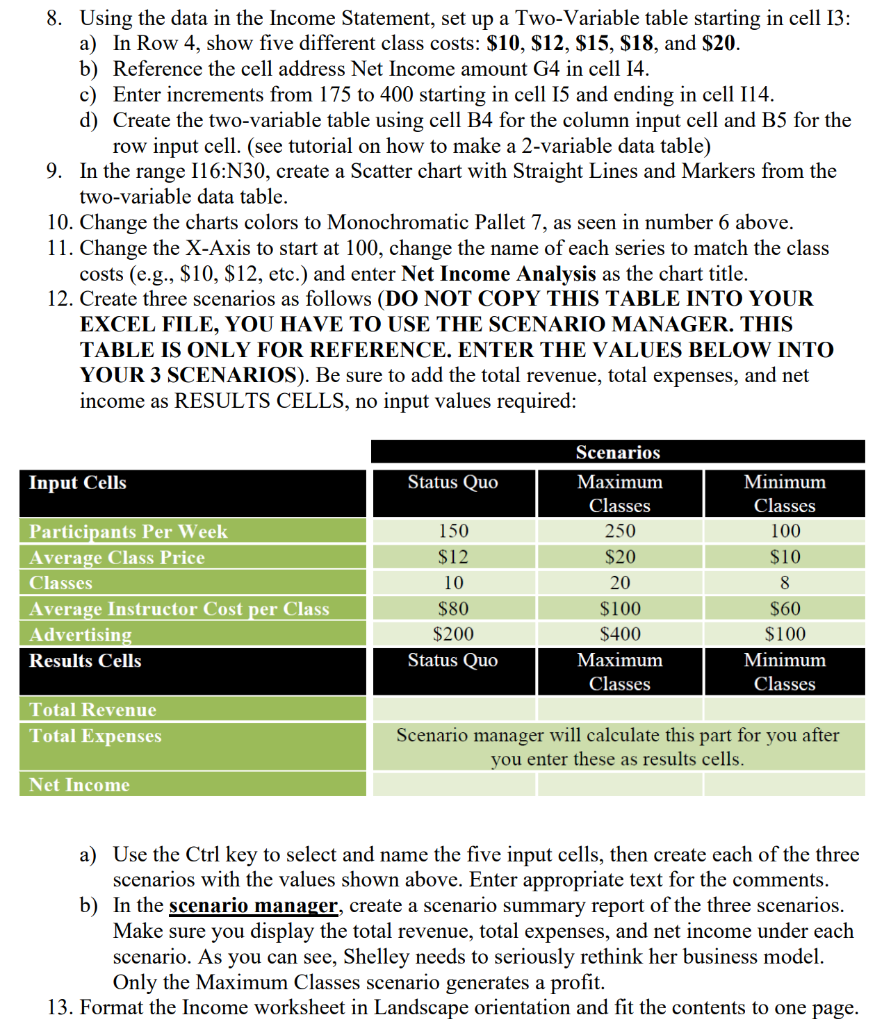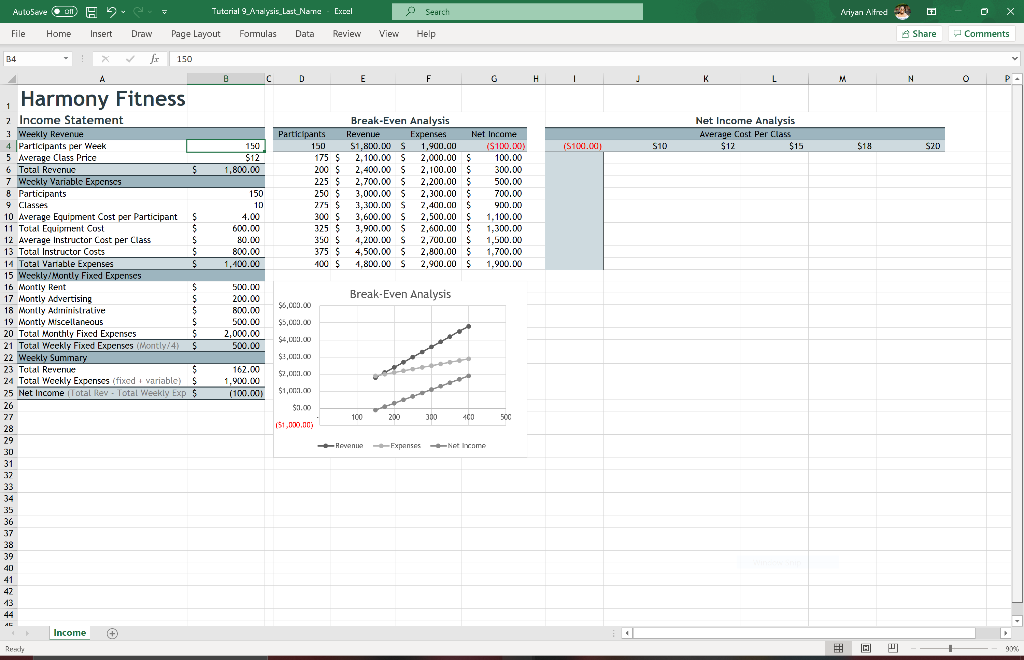

8. Using the data in the Income Statement, set up a Two-Variable table starting in cell 13: a) In Row 4, show five different class costs: $10, $12, $15, $18, and $20. b) Reference the cell address Net Income amount G4 in cell 14. c) Enter increments from 175 to 400 starting in cell 15 and ending in cell 114. d) Create the two-variable table using cell B4 for the column input cell and B5 for the row input cell. (see tutorial on how to make a 2-variable data table) 9. In the range 116:N30, create a Scatter chart with Straight Lines and Markers from the two-variable data table. 10. Change the charts colors to Monochromatic Pallet 7, as seen in number 6 above. 11. Change the X-Axis to start at 100, change the name of each series to match the class costs (e.g., $10, $12, etc.) and enter Net Income Analysis as the chart title. 12. Create three scenarios as follows (DO NOT COPY THIS TABLE INTO YOUR EXCEL FILE, YOU HAVE TO USE THE SCENARIO MANAGER. THIS TABLE IS ONLY FOR REFERENCE. ENTER THE VALUES BELOW INTO YOUR 3 SCENARIOS). Be sure to add the total revenue, total expenses, and net income as RESULTS CELLS, no input values required: Input Cells Status Quo Minimum Classes 100 $10 Participants Per Week Average Class Price Classes Average Instructor Cost per Class Advertising Results Cells 150 $12 10 $80 $200 Status Quo Scenarios Maximum Classes 250 $20 20 $100 $400 Maximum Classes 8 $60 $100 Minimum Classes Total Revenue Total Expenses Scenario manager will calculate this part for you after you enter these as results cells. Net Income a) Use the Ctrl key to select and name the five input cells, then create each of the three scenarios with the values shown above. Enter appropriate text for the comments. b) In the scenario manager, create a scenario summary report of the three scenarios. Make sure you display the total revenue, total expenses, and net income under each scenario. As you can see, Shelley needs to seriously rethink her business model. Only the Maximum Classes scenario generates a profit. 13. Format the Income worksheet in Landscape orientation and fit the contents to one page. AutoSevel . Tutorial Analysis_Last Name Excel Search Ariyan Alfred File Home Insert Draw Page Layout Formulas Data Review View Help Share Comments 34 f 150 B C D E F G H 1 K M N P Harmony Fitness Net Income Analysis Average Cost Per Class $12 $15 ($100.XII S10 $18 $20 150 $12 1,800.00 150 10 4.00 600.00 80.00 800.00 1,400.00 Participants 150 175 $ 200 $ 225 $ 250 $ 275 $ 300 $ 325 $ 350 $ 375 $ 100 $ Break-Even Analysis Revenije Expenses Net Income $1,800.00 $ 1,900.00 ($100.00) 2,100.00 $ 2,000.00 $ 100.00 2,400.00 $ 2,100.00 $ 300.00 2,700.00 $ 2,200.00 $ 500.00 3,000.00 $ 2,300.00 $ 700.00 3,300.00 $ 2,400.00 $ 900.00 3.600.00 S 2,500.00 $ 1.100.00 3,900.00 $ 2,600.00 $ 1,300,00 4,200.00 S 2,700.00 $ 1,500.00 4,500.00 $ 2,800.00 $ 1,700.00 1.800.00 S 2,900.00 $ 1,900.00 Break-Even Analysis $6,000.00 50X3.00 200.00 800.00 500.00 2,000.00 500.00 $5,000.00 $4,000.00 $3,000.00 z Income Statement 3 Weekly Revenue 4 Participants per Week 5 Average Class Price 6 Total Revenue $ 7 Weekly Variable Expenses 8 Participants 9 Classes 10 Average Equipment Cost per Participant $ 11 Total Equipment Cost $ 12 Average Instructor Cost per Class $ 13 Total Instructor Costs $ 14 Total Vanable Expenses $ 15 Weekly/Montly Fixed Expenses 16 Montly Rent $ 17 Montly Advertising $ 18 Montly Administrative $ 19 Montly Miscellaneous S 20 Total Monthly Fixed Expenses $ 21 Total Weekly Fixed Expenses (Montly/4) 4 $ 22 Weekly Summary 23 Total Revenue $ 24 Total Weekly Expenses (fixed variable) $ 25 Net Income Total Rev - Total Weekly Exp $ 26 27 28 29 30 31 37 33 34 35 36 37 38 39 40 41 42 13 44 45 Income $2.0031.00 162.00 1,900.00 (100.00) $1,000.00 $31.00 100 290 300 400 50C (51,000,00) Revenue Expanses -Net me Rexhy + 99 8. Using the data in the Income Statement, set up a Two-Variable table starting in cell 13: a) In Row 4, show five different class costs: $10, $12, $15, $18, and $20. b) Reference the cell address Net Income amount G4 in cell 14. c) Enter increments from 175 to 400 starting in cell 15 and ending in cell 114. d) Create the two-variable table using cell B4 for the column input cell and B5 for the row input cell. (see tutorial on how to make a 2-variable data table) 9. In the range 116:N30, create a Scatter chart with Straight Lines and Markers from the two-variable data table. 10. Change the charts colors to Monochromatic Pallet 7, as seen in number 6 above. 11. Change the X-Axis to start at 100, change the name of each series to match the class costs (e.g., $10, $12, etc.) and enter Net Income Analysis as the chart title. 12. Create three scenarios as follows (DO NOT COPY THIS TABLE INTO YOUR EXCEL FILE, YOU HAVE TO USE THE SCENARIO MANAGER. THIS TABLE IS ONLY FOR REFERENCE. ENTER THE VALUES BELOW INTO YOUR 3 SCENARIOS). Be sure to add the total revenue, total expenses, and net income as RESULTS CELLS, no input values required: Input Cells Status Quo Minimum Classes 100 $10 Participants Per Week Average Class Price Classes Average Instructor Cost per Class Advertising Results Cells 150 $12 10 $80 $200 Status Quo Scenarios Maximum Classes 250 $20 20 $100 $400 Maximum Classes 8 $60 $100 Minimum Classes Total Revenue Total Expenses Scenario manager will calculate this part for you after you enter these as results cells. Net Income a) Use the Ctrl key to select and name the five input cells, then create each of the three scenarios with the values shown above. Enter appropriate text for the comments. b) In the scenario manager, create a scenario summary report of the three scenarios. Make sure you display the total revenue, total expenses, and net income under each scenario. As you can see, Shelley needs to seriously rethink her business model. Only the Maximum Classes scenario generates a profit. 13. Format the Income worksheet in Landscape orientation and fit the contents to one page. AutoSevel . Tutorial Analysis_Last Name Excel Search Ariyan Alfred File Home Insert Draw Page Layout Formulas Data Review View Help Share Comments 34 f 150 B C D E F G H 1 K M N P Harmony Fitness Net Income Analysis Average Cost Per Class $12 $15 ($100.XII S10 $18 $20 150 $12 1,800.00 150 10 4.00 600.00 80.00 800.00 1,400.00 Participants 150 175 $ 200 $ 225 $ 250 $ 275 $ 300 $ 325 $ 350 $ 375 $ 100 $ Break-Even Analysis Revenije Expenses Net Income $1,800.00 $ 1,900.00 ($100.00) 2,100.00 $ 2,000.00 $ 100.00 2,400.00 $ 2,100.00 $ 300.00 2,700.00 $ 2,200.00 $ 500.00 3,000.00 $ 2,300.00 $ 700.00 3,300.00 $ 2,400.00 $ 900.00 3.600.00 S 2,500.00 $ 1.100.00 3,900.00 $ 2,600.00 $ 1,300,00 4,200.00 S 2,700.00 $ 1,500.00 4,500.00 $ 2,800.00 $ 1,700.00 1.800.00 S 2,900.00 $ 1,900.00 Break-Even Analysis $6,000.00 50X3.00 200.00 800.00 500.00 2,000.00 500.00 $5,000.00 $4,000.00 $3,000.00 z Income Statement 3 Weekly Revenue 4 Participants per Week 5 Average Class Price 6 Total Revenue $ 7 Weekly Variable Expenses 8 Participants 9 Classes 10 Average Equipment Cost per Participant $ 11 Total Equipment Cost $ 12 Average Instructor Cost per Class $ 13 Total Instructor Costs $ 14 Total Vanable Expenses $ 15 Weekly/Montly Fixed Expenses 16 Montly Rent $ 17 Montly Advertising $ 18 Montly Administrative $ 19 Montly Miscellaneous S 20 Total Monthly Fixed Expenses $ 21 Total Weekly Fixed Expenses (Montly/4) 4 $ 22 Weekly Summary 23 Total Revenue $ 24 Total Weekly Expenses (fixed variable) $ 25 Net Income Total Rev - Total Weekly Exp $ 26 27 28 29 30 31 37 33 34 35 36 37 38 39 40 41 42 13 44 45 Income $2.0031.00 162.00 1,900.00 (100.00) $1,000.00 $31.00 100 290 300 400 50C (51,000,00) Revenue Expanses -Net me Rexhy + 99


