

Answered step by step
Verified Expert Solution
Question
1 Approved Answer
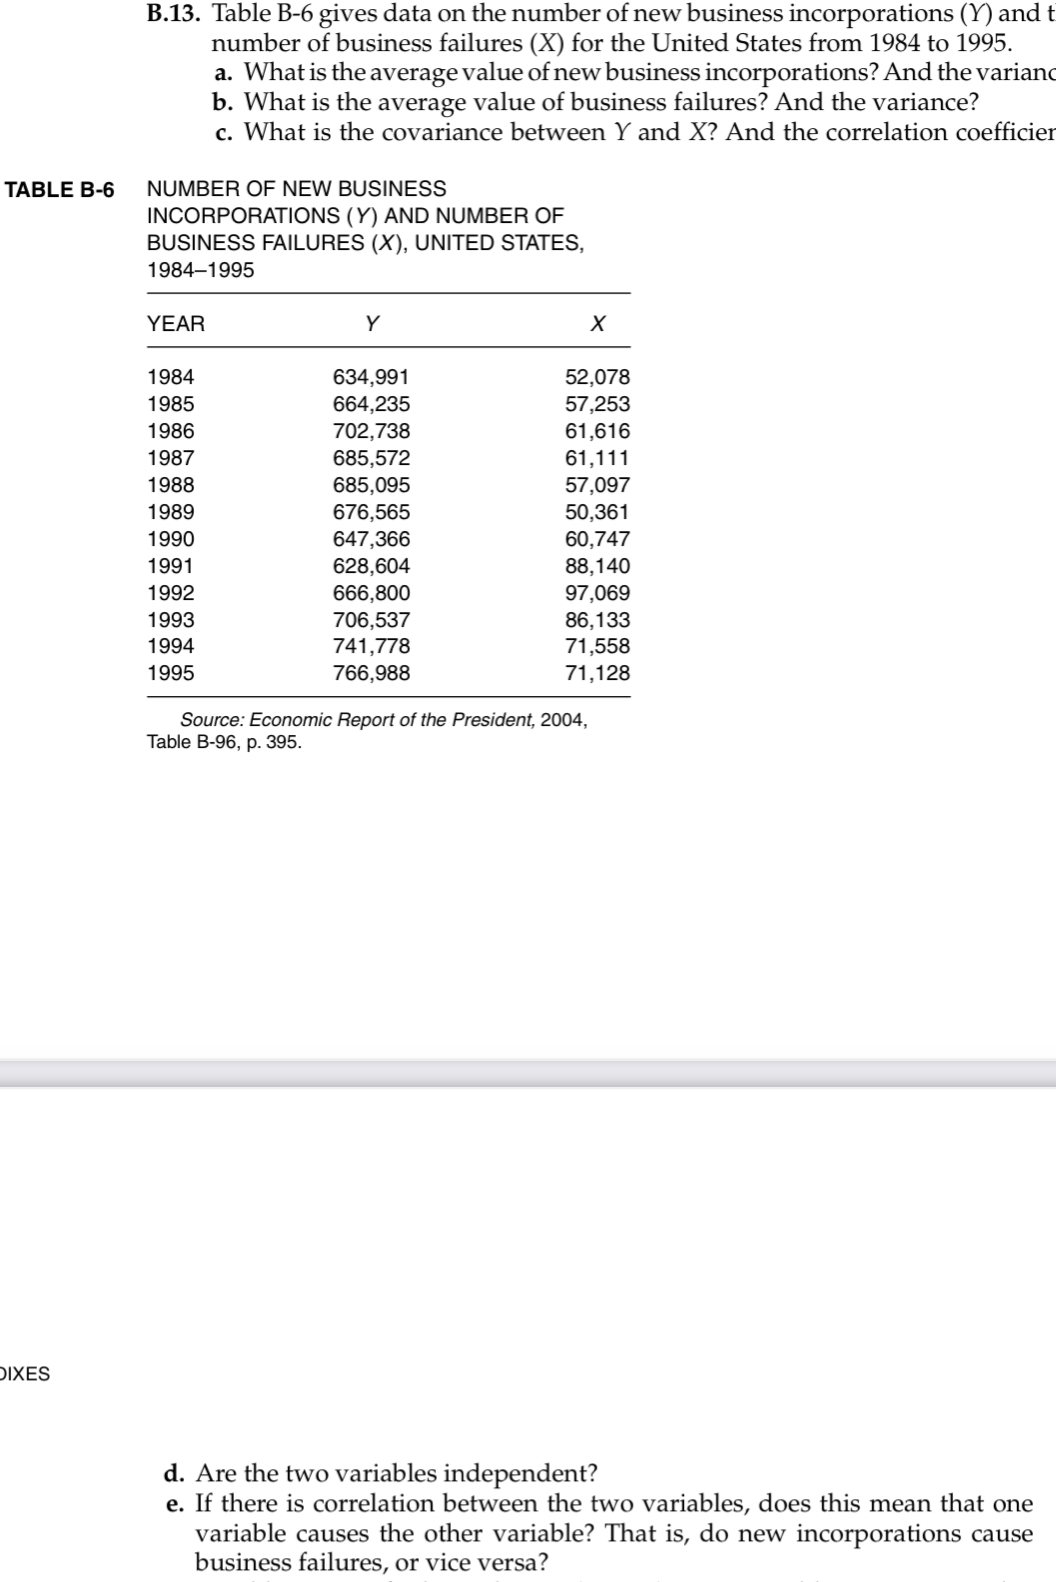
8.13. Table 13-6 gives data on the number of new business incorporations (Y) and t number of business failures (X) for the United States from


Step by Step Solution
There are 3 Steps involved in it
Step: 1

Get Instant Access to Expert-Tailored Solutions
See step-by-step solutions with expert insights and AI powered tools for academic success
Step: 2

Step: 3
Ace Your Homework with AI
Get the answers you need in no time with our AI-driven, step-by-step assistance
Get Started
Essentials of Econometrics
Authors: Damodar Gujarati, Dawn Porter
4th edition
73375845, 978-0071276078, 71276076, 978-0073375847