838 M 0 N Fhall 4% 10 Compare Means > Means ... on the top menu as shown below. Analyze Graphs Utilities Extensions Window Help
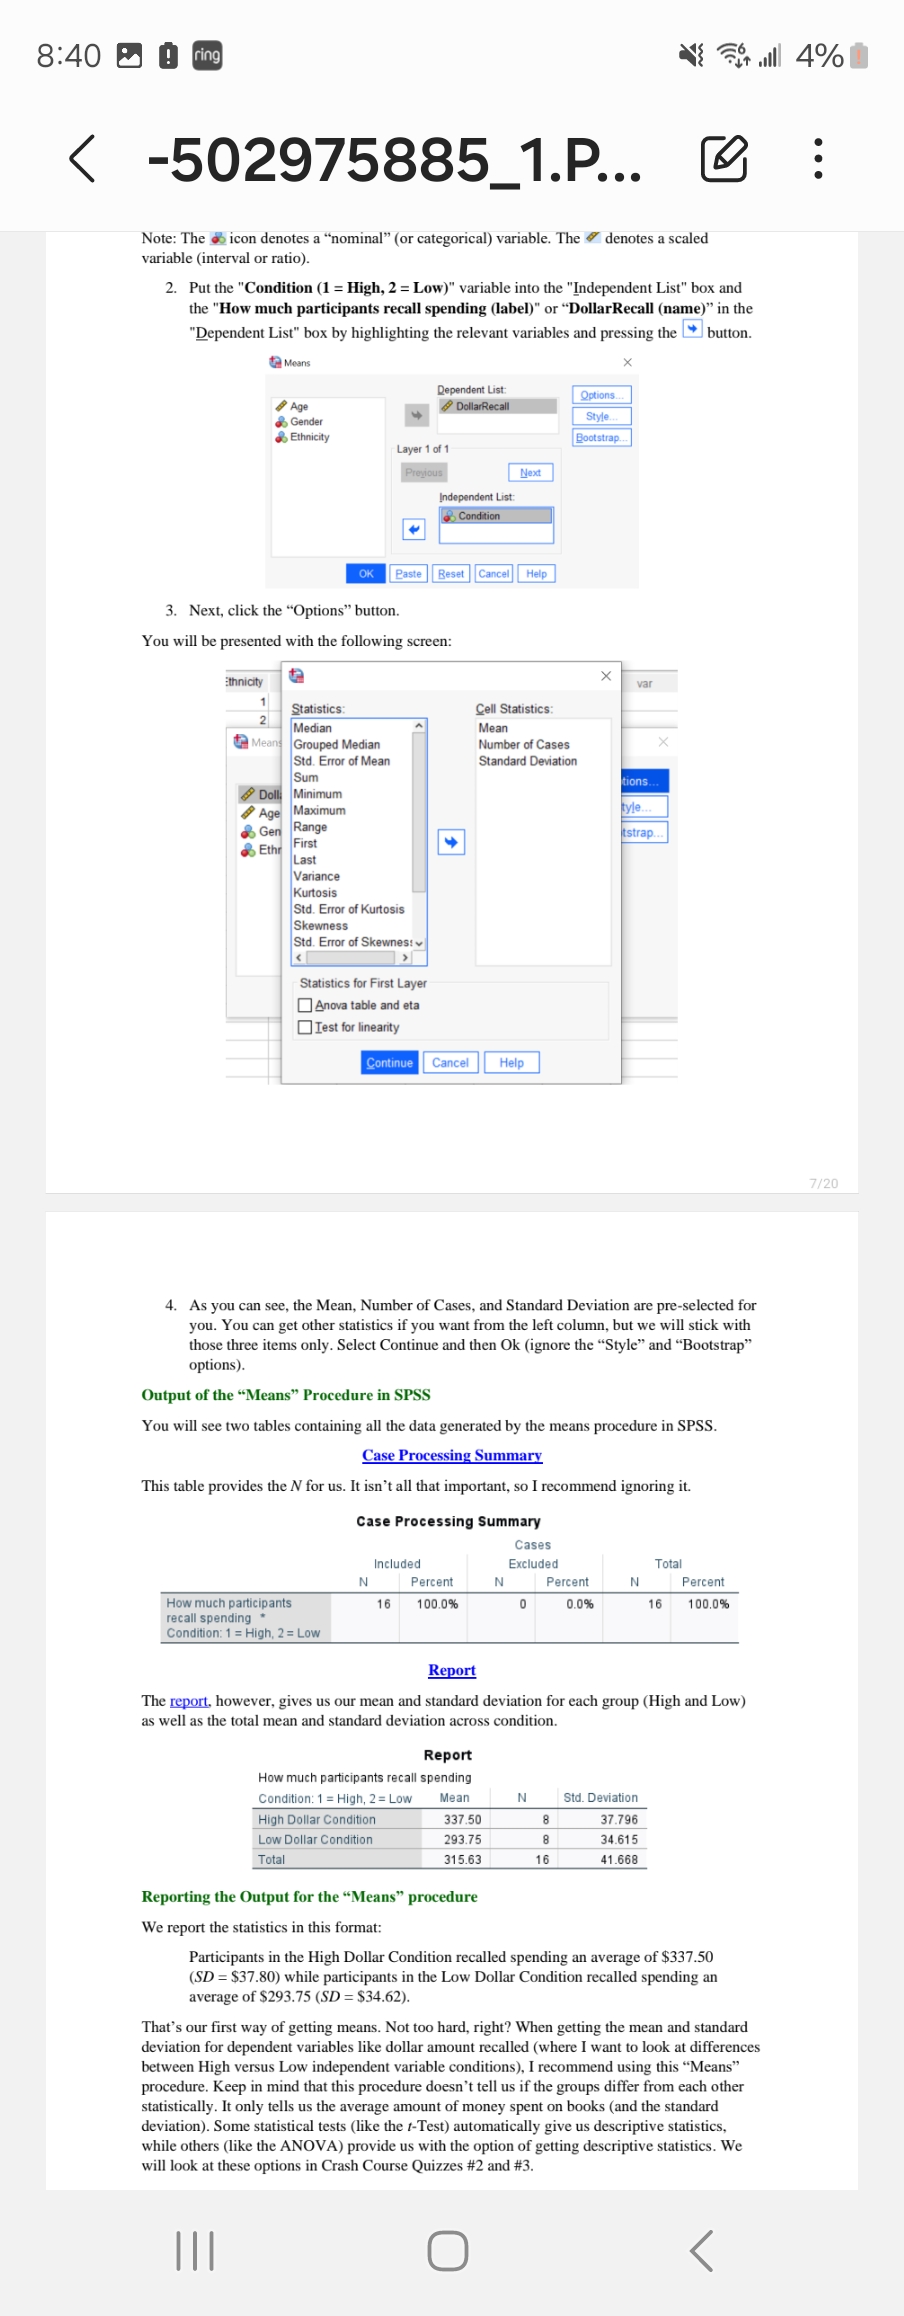
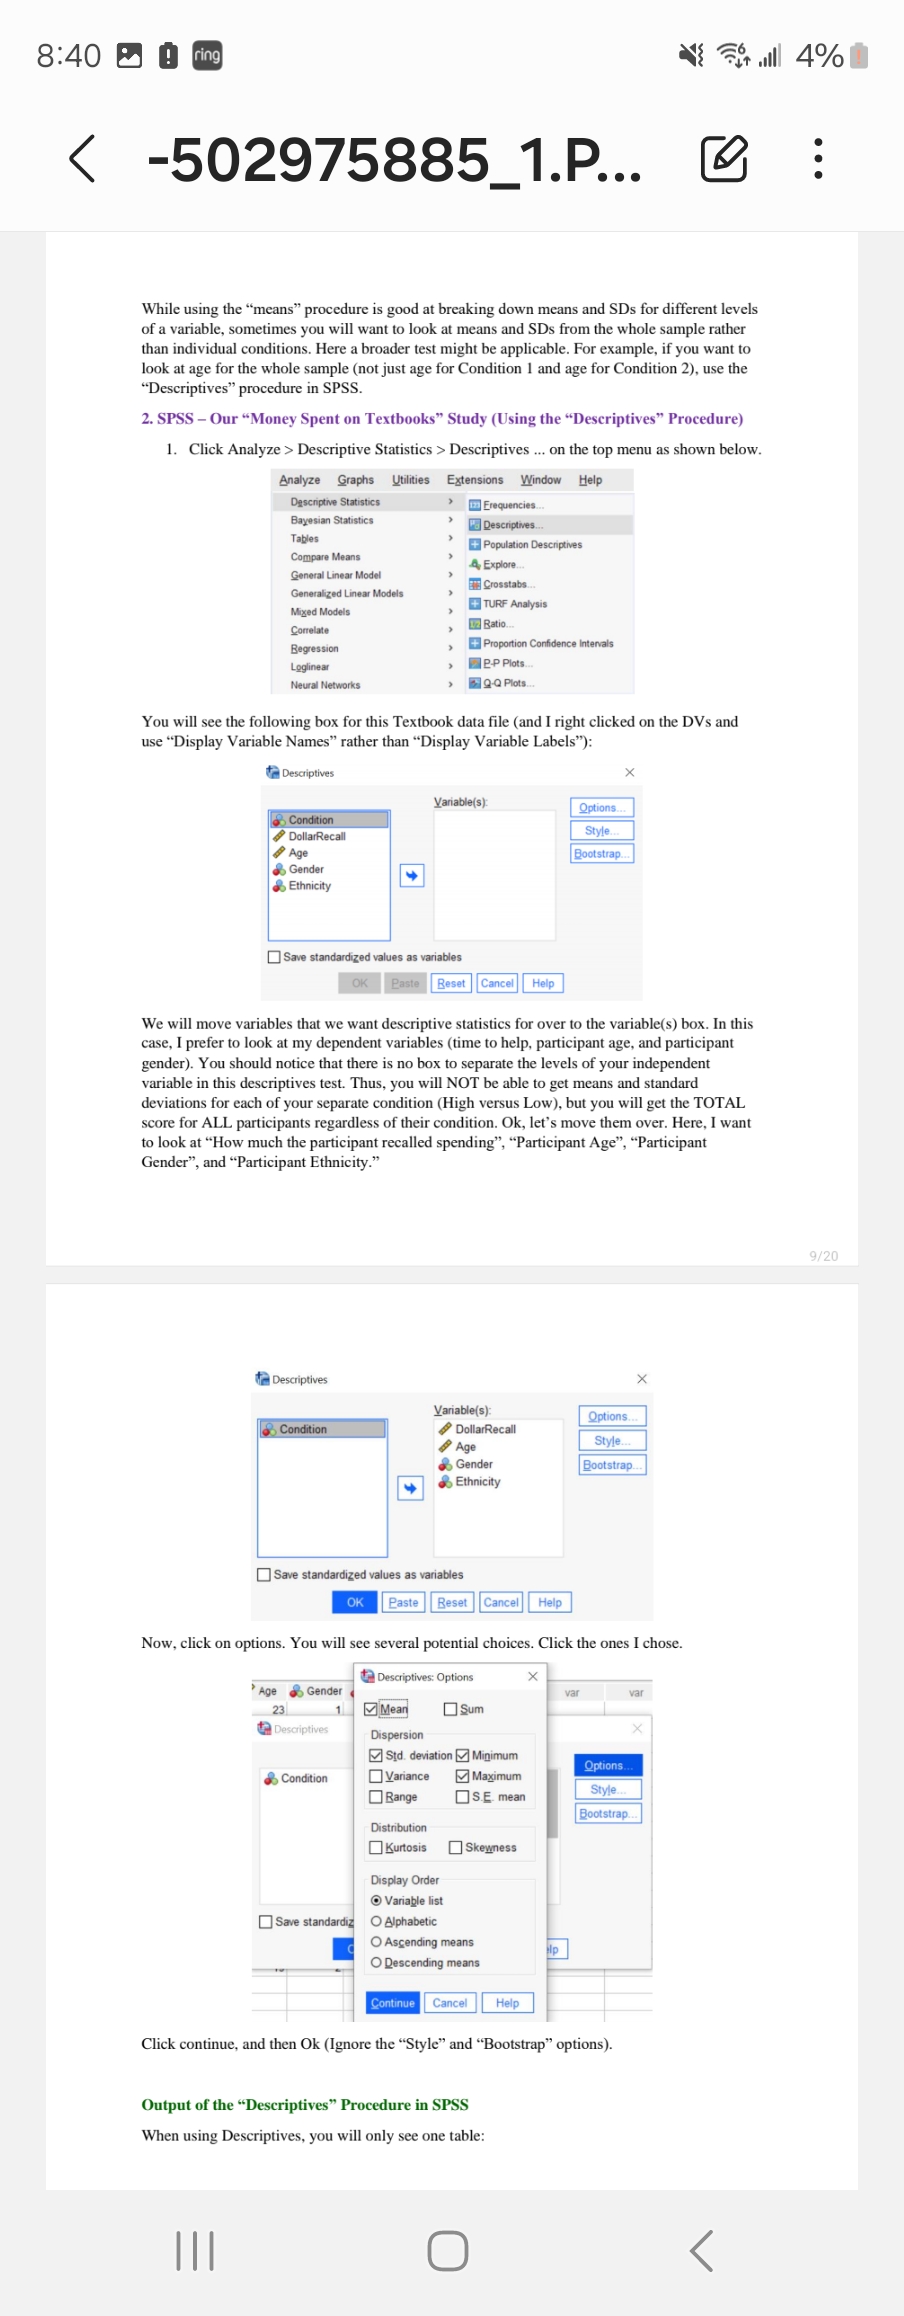
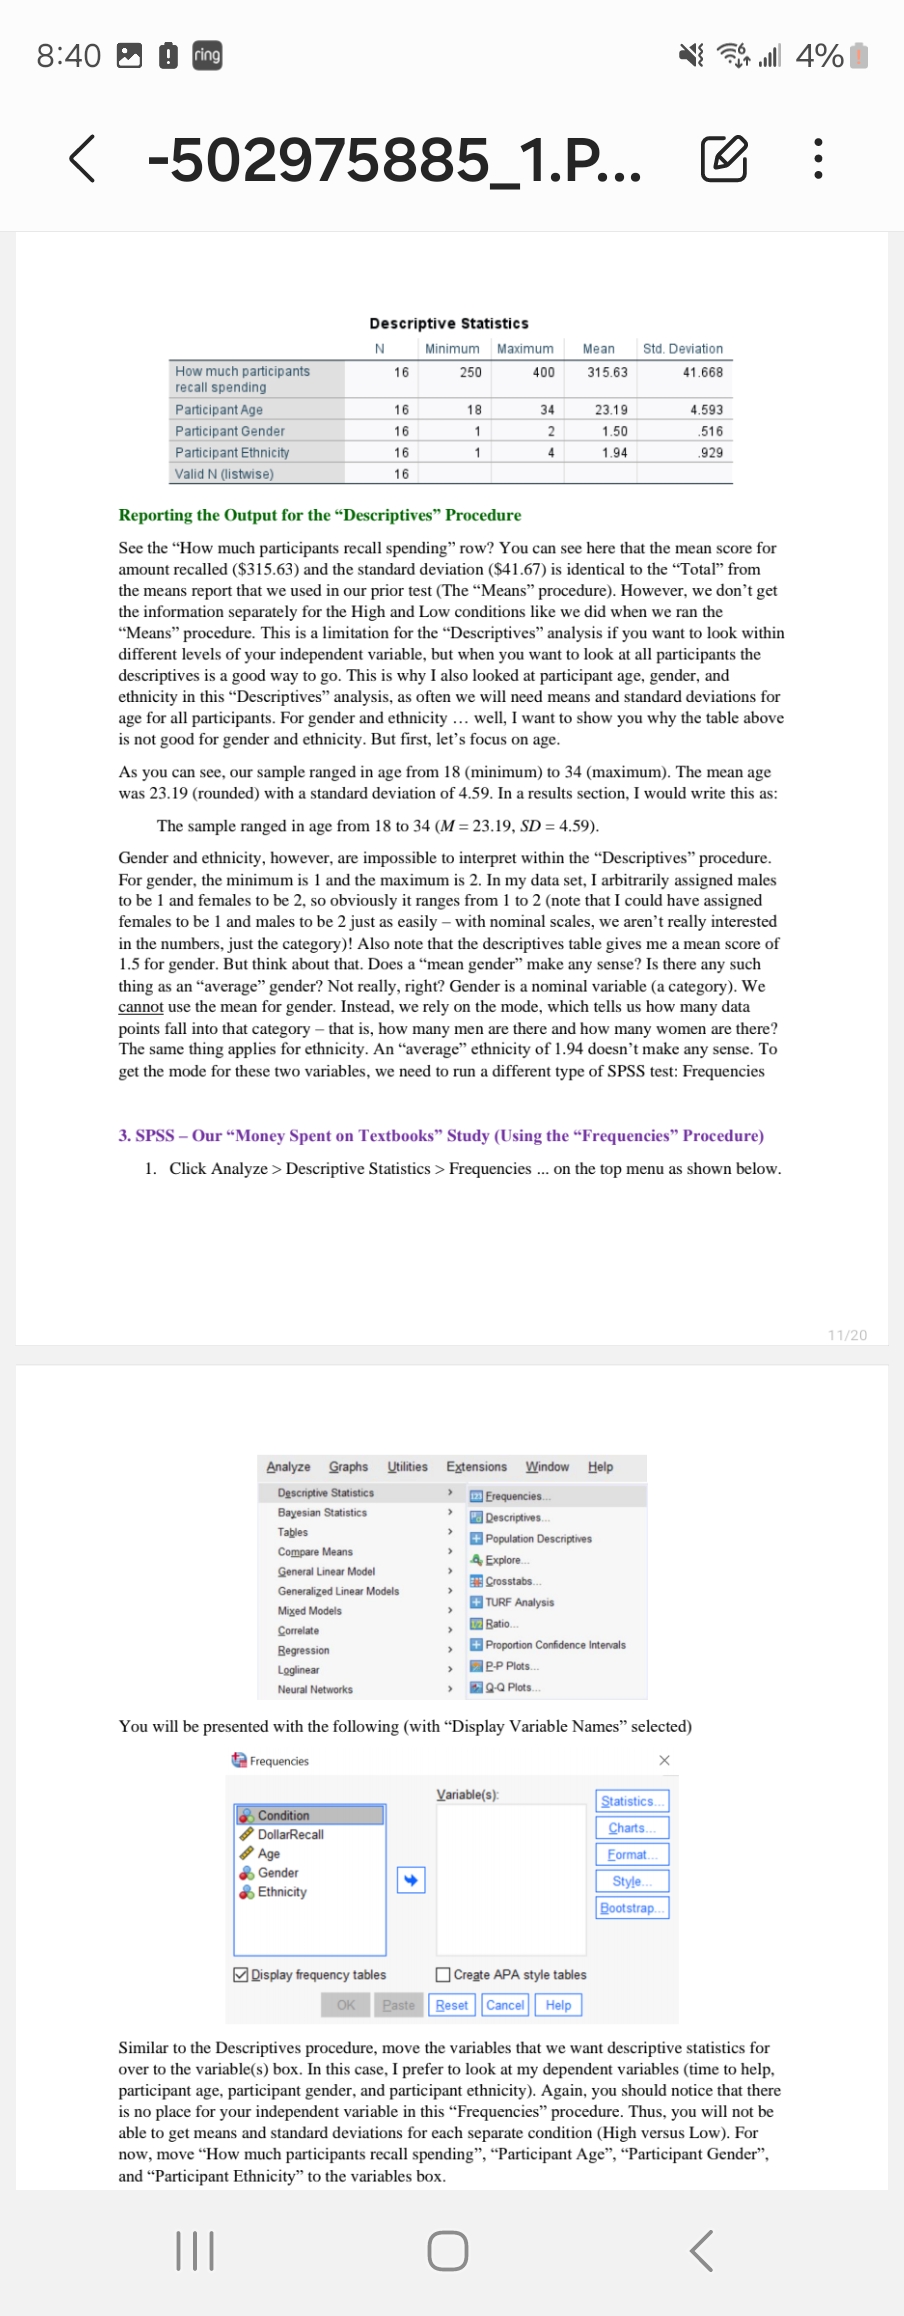
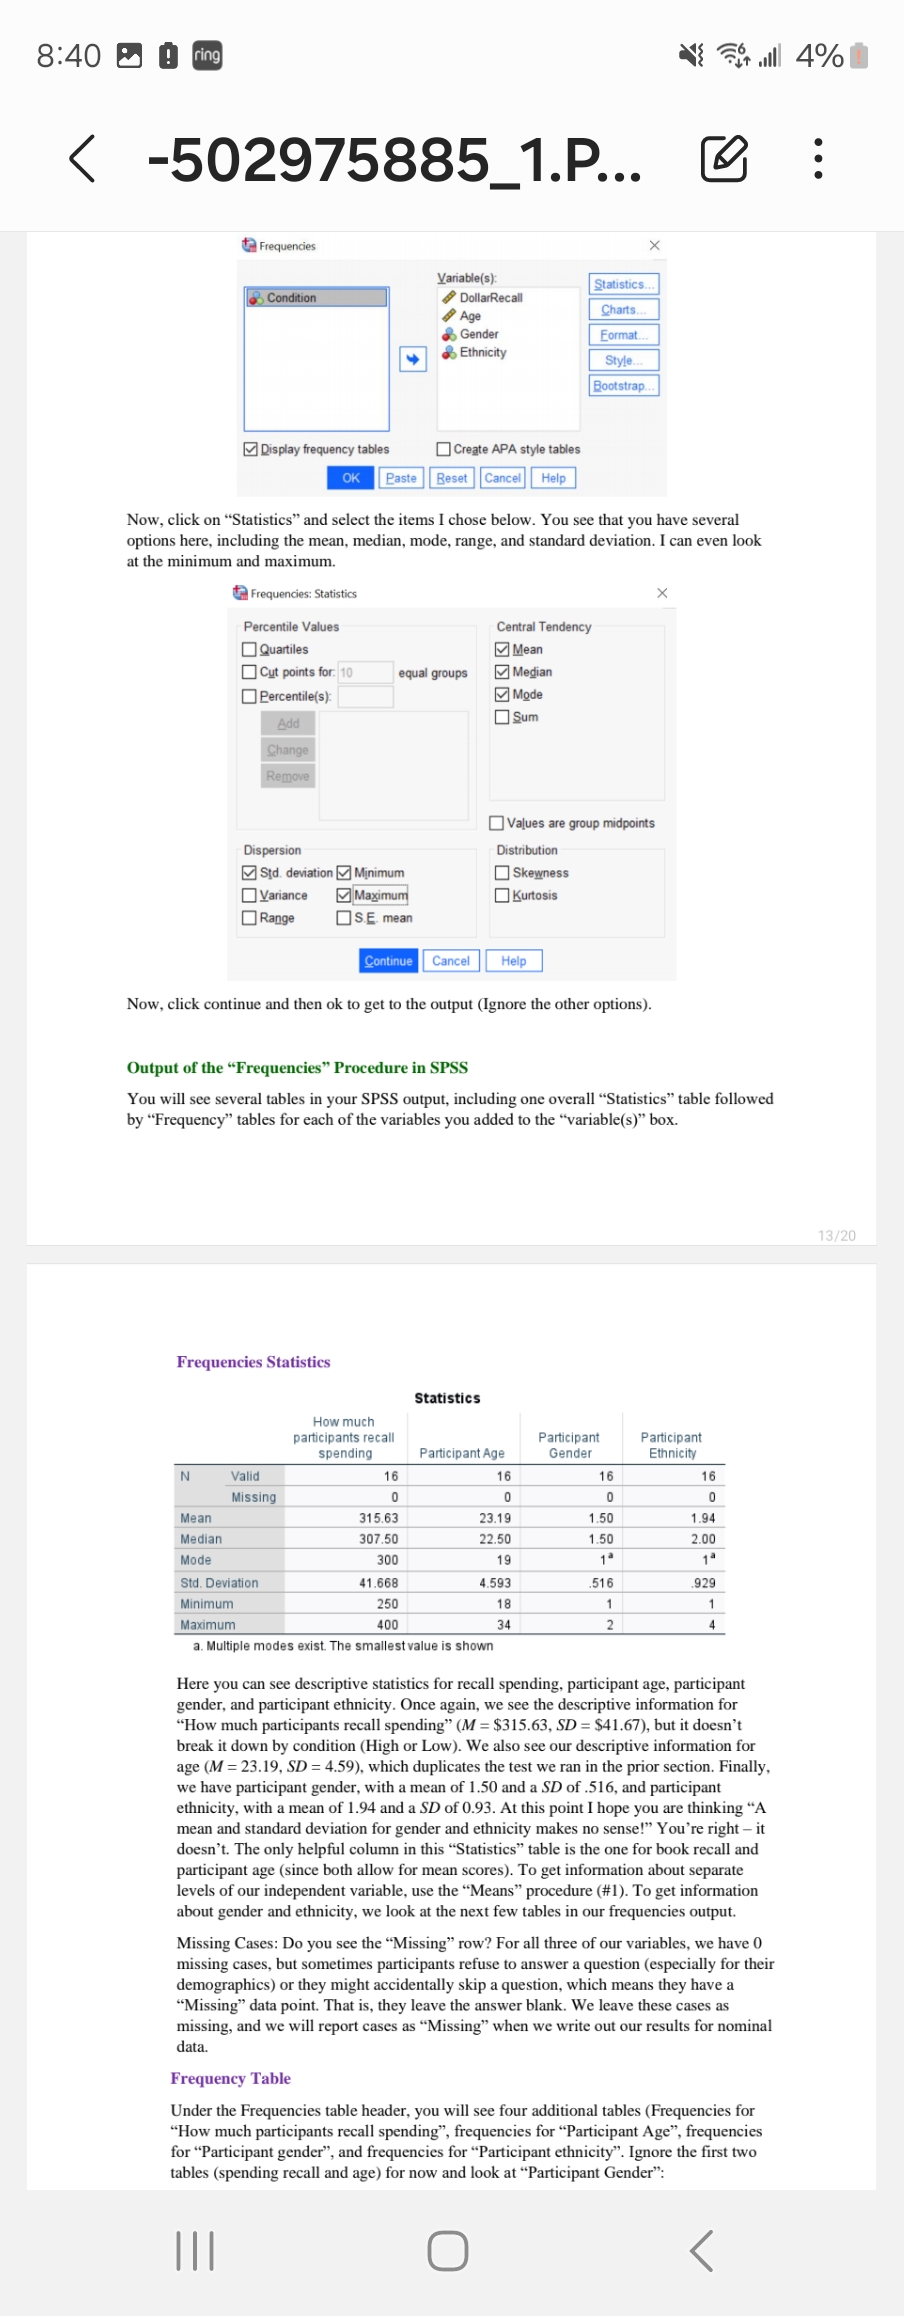
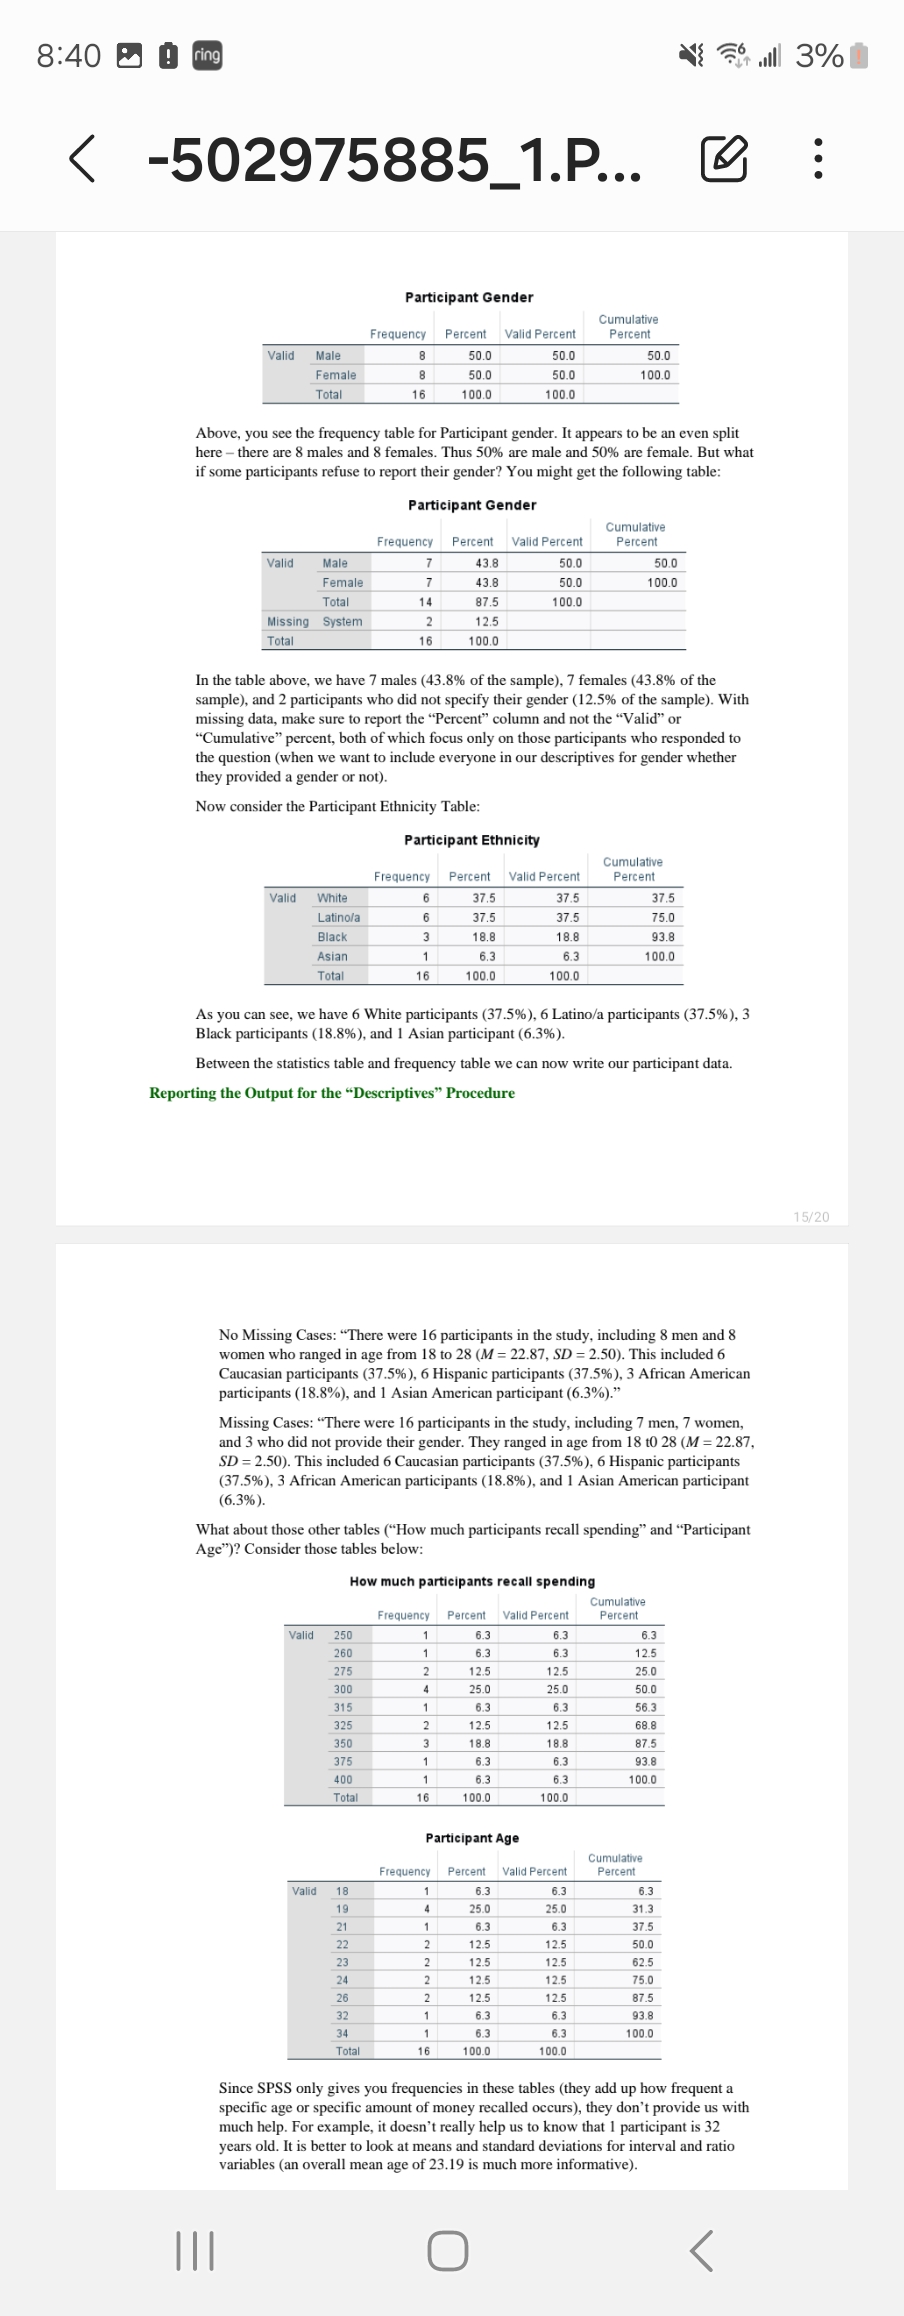
838 M 0 N Fhall 4% 10 Compare Means > Means ... on the top menu as shown below. Analyze Graphs Utilities Extensions Window Help Descriptive Statistics Bayesian Statistics Tables Compare Means M Means. General Linear Model One-Sample T Test.. Generalized Linear Models Independent-Samples T Test. Miged Models + Summary Independent-Samples T Test Correlate Paired-Samples T Test. Regression Loglinear One-Way ANOVA Neural Networks Z One-Sample Proportions Massity Independent-Samples Proportions. Dimension Reduction Paired-Samples Proportions.. You will be presented with the following: Means pendent List Condition: 1 = Hig. How much particip.. Style Participant Age (A. Bootstrap Participant Gender. Layer 1 of 1 &Participant Ethnici Independent Lis Baste Beset Cancel Help If you "right click" on the dependent variables, you can select "Display Variable Names". Sometimes Variable names are shorter than labels and might be work with: Means Dependent List Condition Options endent List Style. Options Display Variable Names O Display Variable Labels Bootstrap.. ayer 1 of O Sort Alphabetically Sort By File Order O Sort By Measurement Level pendent List Variable Information.. OK Paste Beset Cancel Help OK Paste Beset Cancel Help O840 Mm@ N Zhall 4% 1 strap. - Statistics for First Layer [J Anova table and eta [ Test for linearity 4. As you can see, the Mean, Number of Cases, and Standard Deviation are pre-selected for you. You can get other statistics if you want from the left column, but we will stick with those three items only. Select Continue and then Ok (ignore the \"Style and \"Bootstrap options). Output of the \"Means\" Procedure in SPSS You will see two tables containing all the data generated by the means procedure in SPSS. Case Processing Summary This table provides the N for us. It isn't all that important, so I recommend ignoring it. Case Processing Summary Cases Included Excluded Total N Percent N Percent N Percent How much participants 186 100.0% o 0.0% 16 100.0% recall spending * Conditiol Low Report The report, however, gives us our mean and standard deviation for each group (High and Low) as well as the total mean and standard deviation across condition. Report How much participants recall spending Condition: 1 = High, 2= Low Mean N Std. Deviation High Dollar Condition 337.50 8 37.796 Low Dollar Condition 28375 8 u S|57 Total 315.63 16 41.668 Reporting the Output for the \"Means procedure We report the statistics in this format: Participants in the High Dollar Condition recalled spending an average of $337.50 (SD = $37.80) while participants in the Low Dollar Condition recalled spending an average of $293.75 (SD = $34.62). That's our first way of getting means. Not too hard, right? When getting the mean and standard deviation for dependent variables like dollar amount recalled (where I want to look at differences between High versus Low independent variable conditions), I recommend using this \"Means procedure. Keep in mind that this procedure doesn't tell us if the groups differ from each other statistically. It only tells us the average amount of money spent on books (and the standard deviation). Some statistical tests (like the -Test) automatically give us descriptive statistics, while others (like the ANOVA) provide us with the option of getting descriptive statistics. We will look at these options in Crash Course Quizzes #2 and #3. |1 O Descriptive Statistics > Descriptives ... on the top menu as shown below. Analyze Graphs U Utilities Extensions Window Help Descriptive Statistics i Frequencies. Bayesian Statistics Descriptives.. Tables + Population Descriptives Compare Means A Explore General Linear Model Crosstabs Generalized Linear Models Mixed Models + TURF Analysis Correlate U2 Ratio. Regression + Proportion Confidence Intervals Loglinear P-P Plots Neural Networks 9-Q Plots. You will see the following box for this Textbook data file (and I right clicked on the DVs and use "Display Variable Names" rather than "Display Variable Labels"): Descriptives Variable(s): Condition DollarRecall Style Age Bootstrap.. Gender Ethnicity Save standardized values as variables OK Paste Reset Cancel Help We will move variables that we want descriptive statistics for over to the variable(s) box. In this case, I prefer to look at my dependent variables (time to help, participant age, and participant gender). You should notice that there is no box to separate the levels of your independent variable in this descriptives test. Thus, you will NOT be able to get means and standard deviations for each of your separate condition (High versus Low), but you will get the TOTAL score for ALL participants regardless of their condition. OK, let's move them over. Here, I want to look at "How much the participant recalled spending", "Participant Age", "Participant Gender", and "Participant Ethnicity." 9/20 Descriptives X Variable(s): Options. Condition DollarRecall Age Style Gender Bootstrap.. Ethnicity Save standardized values as variables OK Paste Reset Cancel Help Now, click on options. You will see several potential choices. Click the ones I chose. Descriptives: Options Age Gender 23 1 Mean Sum Descriptives Dispersion Sid. deviation Minimum Options.. Condition Variance Maximum Range S.E. mean Style Bootstrap.. Distribution Kurtosis Skewness Display Order Variable list Save standardiz O Alphabetic O Ascending means O Descending means Continue Cancel Help Click continue, and then Ok (Ignore the "Style" and "Bootstrap" options). Output of the "Descriptives" Procedure in SPSS When using Descriptives, you will only see one table: O8:40 2 0 ring it allll 4% Descriptive Statistics > Frequencies ... on the top menu as shown below. 11/20 Analyze Graphs Utilities Extensions Window Help Descriptive Statistics 123 Frequencies Bayesian Statistics aDescriptives. Tables + Population Descriptives Compare Means A Explore General Linear Model Crosstabs. Generalized Linear Models Mixed Models + TURF Analysis Correlate 1/2 Ratio. Regression + Proportion Confidence Intervals Loglinear P-P Plots.. Neural Networks Q-Q Plots. You will be presented with the following (with "Display Variable Names" selected) Frequencies Variable(s): Statistics. Condition DollarRecall Charts. Age Format. Gender Style Ethnicity Bootstrap. Display frequency tables Create APA style tables OK Paste Reset Cancel Help Similar to the Descriptives procedure, move the variables that we want descriptive statistics for over to the variable(s) box. In this case, I prefer to look at my dependent variables (time to help, participant age, participant gender, and participant ethnicity). Again, you should notice that there is no place for your independent variable in this "Frequencies" procedure. Thus, you will not be able to get means and standard deviations for each separate condition (High versus Low). For now, move "How much participants recall spending", "Participant Age", "Participant Gender", and "Participant Ethnicity" to the variables box. O840 Mm@
Step by Step Solution
There are 3 Steps involved in it
Step: 1
Get Instant Access to Expert-Tailored Solutions
See step-by-step solutions with expert insights and AI powered tools for academic success
Step: 2
Step: 3
Ace Your Homework with AI
Get the answers you need in no time with our AI-driven, step-by-step assistance