

Answered step by step
Verified Expert Solution
Question
1 Approved Answer
859. The diagram shows the graph * +3 - 3xy = 0. You y + have figured out that it is also the graph of


Step by Step Solution
There are 3 Steps involved in it
Step: 1

Get Instant Access to Expert-Tailored Solutions
See step-by-step solutions with expert insights and AI powered tools for academic success
Step: 2

Step: 3
Ace Your Homework with AI
Get the answers you need in no time with our AI-driven, step-by-step assistance
Get Started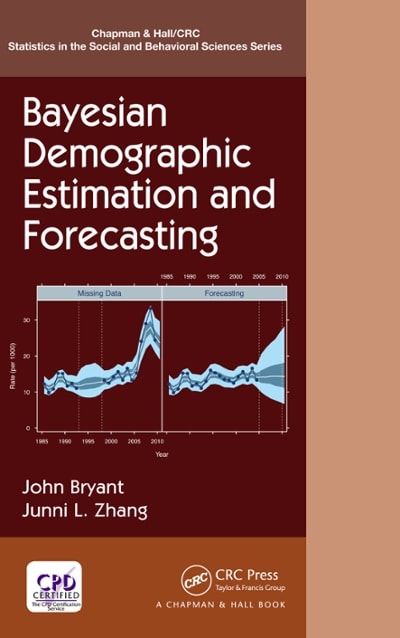
Bayesian Demographic Estimation And Forecasting
Authors: John Bryant, Junni L Zhang
1st Edition
0429841337, 9780429841330