Question
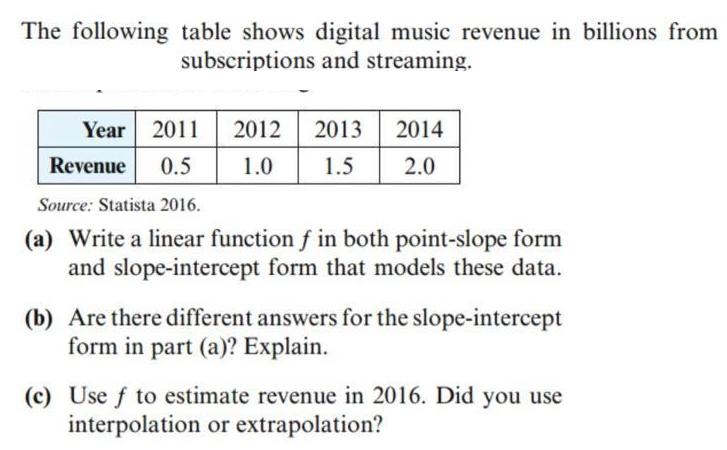
The following table shows digital music revenue in billions from subscriptions and streaming. Year 2011 2012 2013 2014 Revenue 0.5 1.0 1.5 2.0 Source:

The following table shows digital music revenue in billions from subscriptions and streaming. Year 2011 2012 2013 2014 Revenue 0.5 1.0 1.5 2.0 Source: Statista 2016. (a) Write a linear function f in both point-slope form and slope-intercept form that models these data. (b) Are there different answers for the slope-intercept form in part (a)? Explain. (c) Use f to estimate revenue in 2016. Did you use interpolation or extrapolation?
Step by Step Solution
3.47 Rating (167 Votes )
There are 3 Steps involved in it
Step: 1
a Set 2011 as initial time iet0 so that 2102 will be t1 year 2013 will be t 2 years 2014 will be t3 ...
Get Instant Access to Expert-Tailored Solutions
See step-by-step solutions with expert insights and AI powered tools for academic success
Step: 2

Step: 3

Ace Your Homework with AI
Get the answers you need in no time with our AI-driven, step-by-step assistance
Get StartedRecommended Textbook for
Principles of Corporate Finance
Authors: Richard Brealey, Stewart Myers, Franklin Allen
11th edition
978-9332902701, 9332902704, 978-0078034763
Students also viewed these Mathematics questions
Question
Answered: 1 week ago
Question
Answered: 1 week ago
Question
Answered: 1 week ago
Question
Answered: 1 week ago
Question
Answered: 1 week ago
Question
Answered: 1 week ago
Question
Answered: 1 week ago
Question
Answered: 1 week ago
Question
Answered: 1 week ago
Question
Answered: 1 week ago
Question
Answered: 1 week ago
Question
Answered: 1 week ago
Question
Answered: 1 week ago
Question
Answered: 1 week ago
Question
Answered: 1 week ago
Question
Answered: 1 week ago
Question
Answered: 1 week ago
Question
Answered: 1 week ago
Question
Answered: 1 week ago
Question
Answered: 1 week ago
Question
Answered: 1 week ago
Question
Answered: 1 week ago
View Answer in SolutionInn App


