

Answered step by step
Verified Expert Solution
Question
1 Approved Answer
8missing percentages help After graduating from college in May 2018, Ryan Crews started his career in finance at the W&T Corporation, a small to medium-sized
8missing percentages help 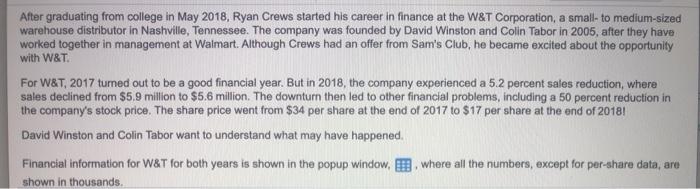
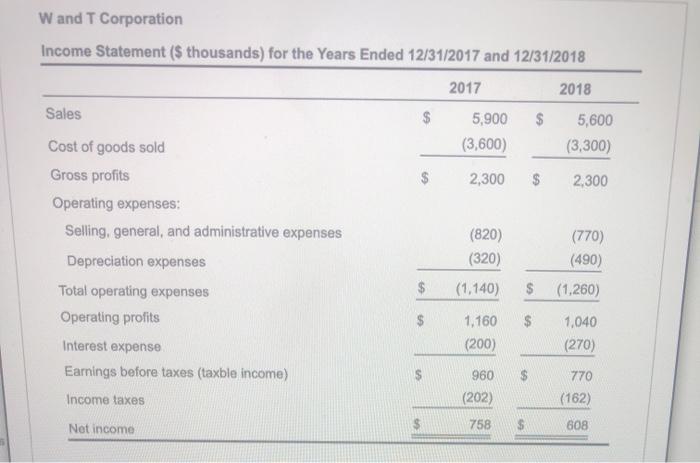
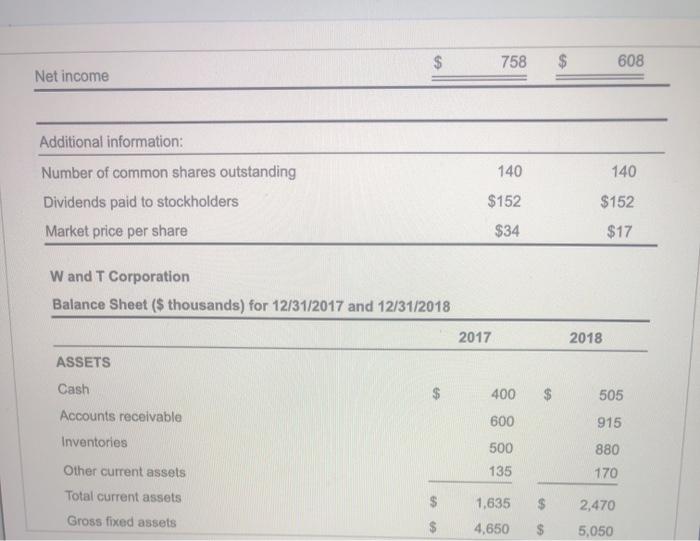
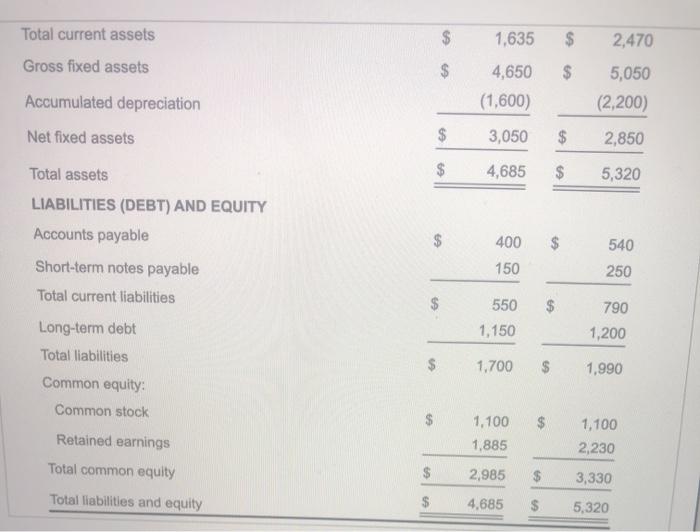
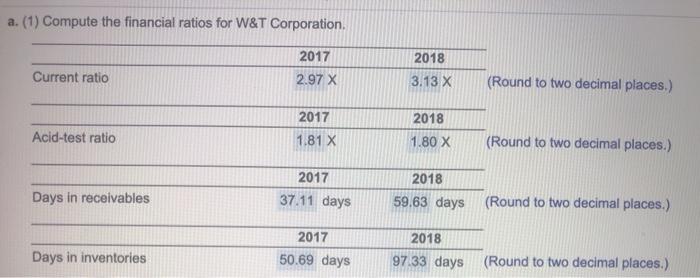
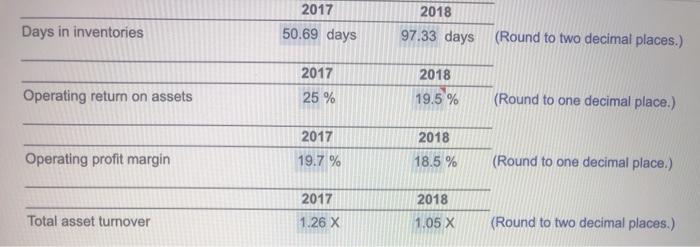
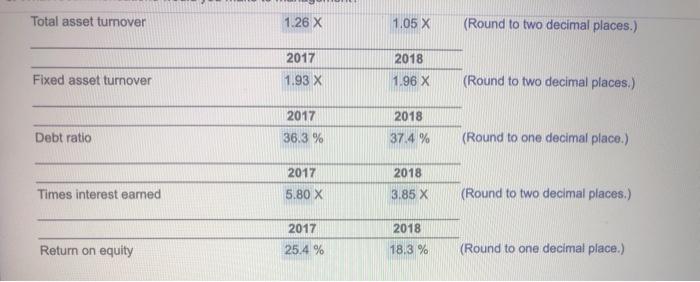
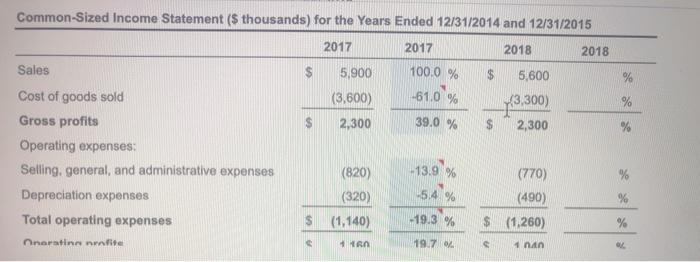
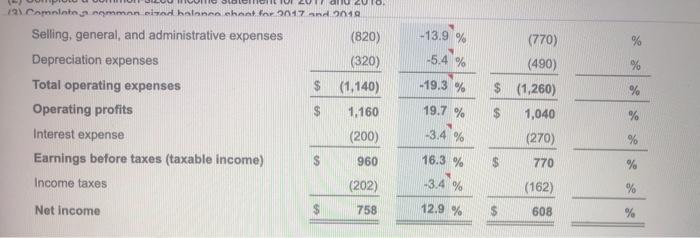
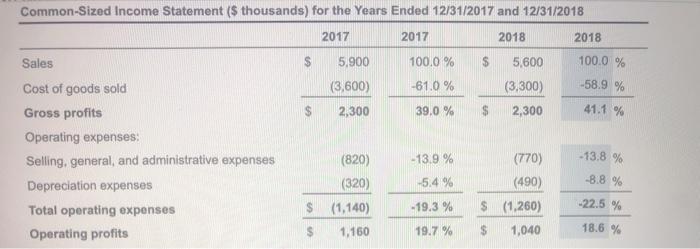
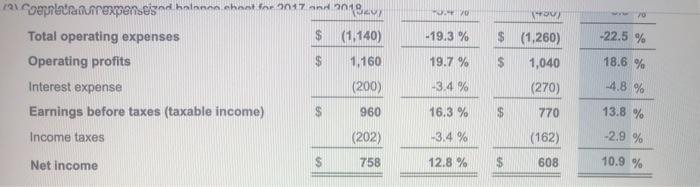
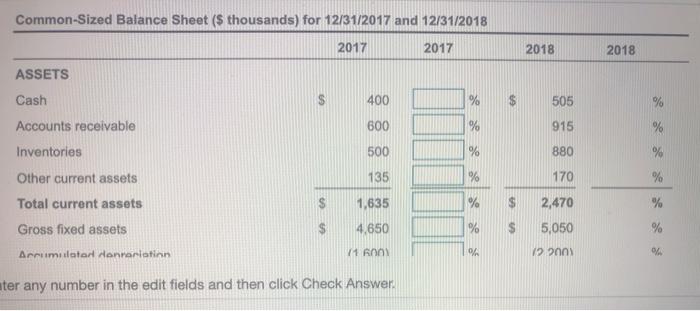
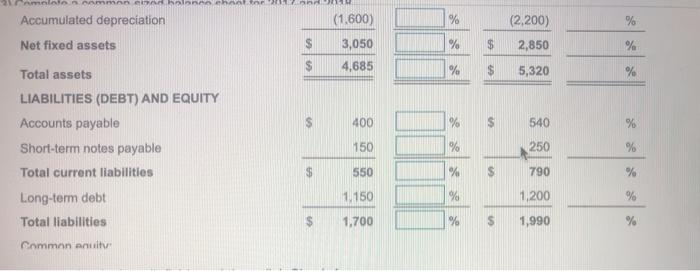
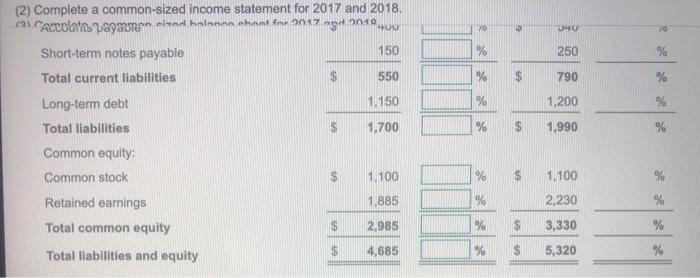
After graduating from college in May 2018, Ryan Crews started his career in finance at the W&T Corporation, a small to medium-sized warehouse distributor in Nashville, Tennessee. The company was founded by David Winston and Colin Tabor in 2005, after they have worked together in management at Walmart. Although Crews had an offer from Sam's Club, he became excited about the opportunity with W&T For W&T, 2017 turned out to be a good financial year. But in 2018, the company experienced a 5.2 percent sales reduction, where sales declined from $5.9 million to $5.6 million. The downturn then led to other financial problems, including a 50 percent reduction in the company's stock price. The share price went from $34 per share at the end of 2017 to $17 per share at the end of 2018! David Winston and Colin Tabor want to understand what may have happened. Financial information for W&T for both years is shown in the popup window, where all the numbers, except for per-share data, are shown in thousands W and T Corporation Income Statement ($ thousands) for the Years Ended 12/31/2017 and 12/31/2018 2017 2018 Sales $ 5,900 (3,600) 5,600 (3,300) $ 2,300 $ 2,300 Cost of goods sold Gross profits Operating expenses: Selling, general, and administrative expenses Depreciation expenses Total operating expenses Operating profits Interest expense Earnings before taxes (taxble income) (820) (320) (770) (490) (1,140) $ (1,260) 1,160 (200) 1.040 (270) $ $ 960 (202) 770 (162) Income taxes $ Not income 758 S 608 758 608 Net income Additional information: 140 140 Number of common shares outstanding Dividends paid to stockholders Market price per share $152 $152 $3 $17 W and T Corporation Balance Sheet ($ thousands) for 12/31/2017 and 12/31/2018 2017 2018 ASSETS Cash 400 505 600 Accounts receivable Inventories 915 500 135 880 170 Other current assets Total current assets $ 1,635 $ 2,470 Gross fixed assets 4,650 $ 5,050 Total current assets $ 1,635 $ Gross fixed assets $ $ 4,650 (1,600) 2,470 5,050 (2,200) Accumulated depreciation Net fixed assets $ $ 3,050 $ 2,850 Total assets $ 4,685 $ 5,320 LIABILITIES (DEBT) AND EQUITY Accounts payable Short-term notes payable $ 400 540 150 250 Total current liabilities $ $ 550 1,150 Long-term debt Total liabilities 790 1,200 1,700 $ 1,990 Common equity: Common stock $ 1,100 1.885 Retained earnings Total common equity 1.100 2,230 16 2,985 3,330 Total liabilities and equity 4,685 $ $ 5,320 a. (1) Compute the financial ratios for W&T Corporation, 2017 Current ratio 2018 3.13 X 2.97 X (Round to two decimal places.) 2017 1.81 X Acid-test ratio 2018 1.80 X (Round to two decimal places.) 2017 Days in receivables 2018 59.63 days 37.11 days (Round to two decimal places.) 2017 50.69 days Days in inventories 2018 97.33 days (Round to two decimal places.) 2017 Days in inventories 50.69 days 2018 97.33 days (Round to two decimal places.) 2017 25 % Operating return on assets 2018 19.5 % (Round to one decimal place.) 2017 19.7 % 2018 18.5 % Operating profit margin (Round to one decimal place.) 2017 2018 1.05 X Total asset turnover 1.26 X (Round to two decimal places.) Total asset turnover 1.26 X 1.05 X (Round to two decimal places.) 2017 1.93 X 2018 1.96 X Fixed asset turnover (Round to two decimal places.) 2017 36.3% 2018 37.4 % Debt ratio (Round to one decimal place.) 2017 2018 Times interest eamed 5.80 X 3.85 X (Round to two decimal places.) 2017 25.4 % 2018 18.3 % Return on equity (Round to one decimal place.) % -||3,300) Common-Sized Income Statement (s thousands) for the Years Ended 12/31/2014 and 12/31/2015 2017 2017 2018 2018 Sales 5,900 100.0 % $ 5,600 Cost of goods sold (3.600) -61.0 % Gross profits $ 2,300 39.0 % 2,300 Operating expenses: Selling, general, and administrative expenses (820) -13.9% (770) Depreciation expenses (320) -5.4 % (490) Total operating expenses $(1,140) -19.3 % $(1,260) 19.704 1 nan narstinn neft % % % HO % % Coming mon irad halanes chantin 2017 and 2010 Selling, general, and administrative expenses (820) Depreciation expenses (320) Total operating expenses $ (1,140) Operating profits S 1,160 Interest expense (200) Earnings before taxes (taxable income) 960 % -13.9% -5.4 % -19.3 % 19.7 % -3.4 % 16.3 % -3.41% (770) (490) $ (1,260) $ 1,040 (270) $ 770 % ele ale malen % Income taxes (202) % (162) 608 Net Income 758 12.9 % $ % -58.9 % Common-Sized Income Statement (s thousands) for the Years Ended 12/31/2017 and 12/31/2018 2017 2017 2018 2018 Sales $ 5,900 100.0 % $ 5,600 100.0 % Cost of goods sold (3,600) -61.0% (3.300) Gross profits $ 2,300 39.0 % 2,300 41.1 % Operating expenses: Selling, general, and administrative expenses (820) -13.9% (770) -13.8 % (320) Depreciation expenses -5,4% (490) Total operating expenses $ (1,140) -19.3 % $ (1,260) Operating profits 1,160 19.7 % 1,040 -8.8 % -22.5 % 18.6 % 0.0 -19.3% $ (1,260) -22.5 % 19.7 % $ 1,040 18.6 % a compararexpensesn halanan chant for 2017 - 2018 Total operating expenses (1.140) Operating profits $ 1.160 Interest expense (200) Earnings before taxes (taxable income) 960 Income taxes (202) -3.4 % 4.8 % 16.3% -3.4 % (270) 770 (162) 13.8 % -2.9 % Net income 758 12.8 % 608 10.9 % Common-Sized Balance Sheet (s thousands) for 12/31/2017 and 12/31/2018 2017 2017 2018 2018 ASSETS 400 % $ 505 600 % 915 Cash Accounts receivable Inventories Other current assets % % 500 % 880 135 % 170 % % % Total current assets Gross fixed assets 1,635 4,650 2,470 5,050 % Accumulator Honrariation 1600 19 200 94 ater any number in the edit fields and then click Check Answer melatonommand hattori Accumulated depreciation (1.600) % (2,200) % Net fixed assets S % $ 2,850 % 3,050 4,685 S % Total assets $ 5,320 % 400 % 540 150 % 250 % LIABILITIES (DEBT) AND EQUITY Accounts payable Short-term notes payable Total current liabilities Long-term debt Total liabilities 550 % S 790 % % % 1,150 1,700 1,200 1,990 $ % $ % Commnn anu 400 70 0 10 % 250 % % 790 % % 1,200 % % (2) Complete a common-sized income statement for 2017 and 2018. Caccolatos pagamen rizas holanan chant for 2017 ngd 2018 150 Short-term notes payable Total current liabilities 550 Long-term debt 1.150 Total liabilities 1,700 Common equity: Common stock 1.100 Retained earnings 1,885 Total common equity 2,985 Total liabilities and equity $ 4,685 $ 1,990 % 1.100 % % % S 2.230 3,330 5,320 % % Step by Step Solution
There are 3 Steps involved in it
Step: 1

Get Instant Access to Expert-Tailored Solutions
See step-by-step solutions with expert insights and AI powered tools for academic success
Step: 2

Step: 3
Ace Your Homework with AI
Get the answers you need in no time with our AI-driven, step-by-step assistance
Get Started
Accounting Principles
Authors: Jerry J. Weygandt, Paul D. Kimmel, Donald E. Kieso, Steinbart Romney B.
9th International Edition
0470409460, 978-0470409466