

Answered step by step
Verified Expert Solution
Question
1 Approved Answer
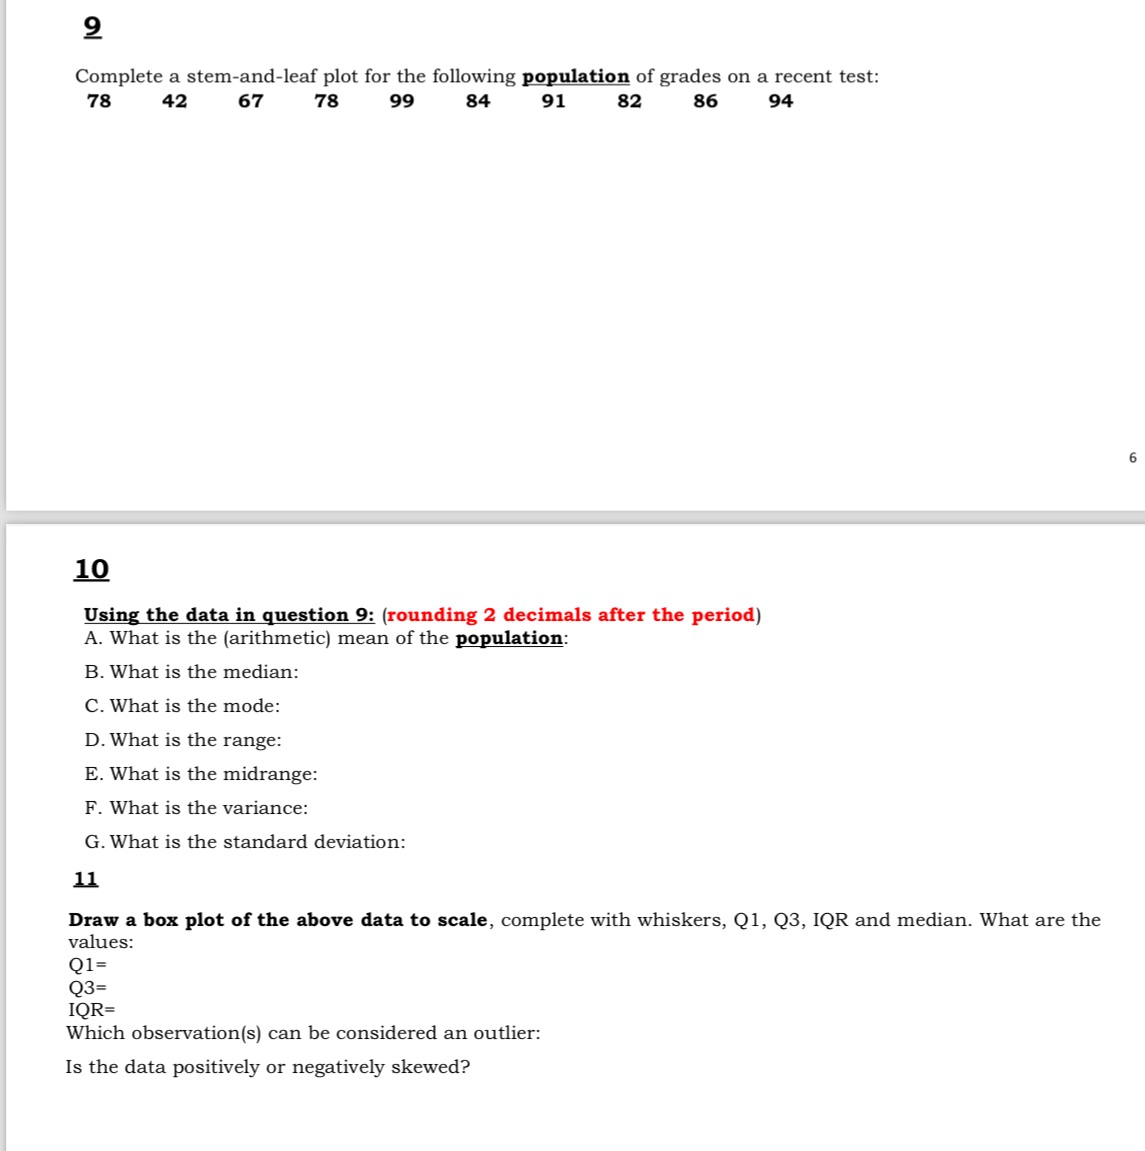
9 Complete a stem-and-leaf plot for the following population of grades on a recent test: 78 42 67 78 99 84 91 82 86 94
Step by Step Solution
There are 3 Steps involved in it
Step: 1

Get Instant Access to Expert-Tailored Solutions
See step-by-step solutions with expert insights and AI powered tools for academic success
Step: 2

Step: 3
Ace Your Homework with AI
Get the answers you need in no time with our AI-driven, step-by-step assistance
Get Started
Mathematical Applications for the Management Life and Social Sciences
Authors: Ronald J. Harshbarger, James J. Reynolds
11th edition
9781337032247, 9781305465183, 1305108043, 1337032247, 1305465180, 978-1305108042