

Answered step by step
Verified Expert Solution
Question
1 Approved Answer
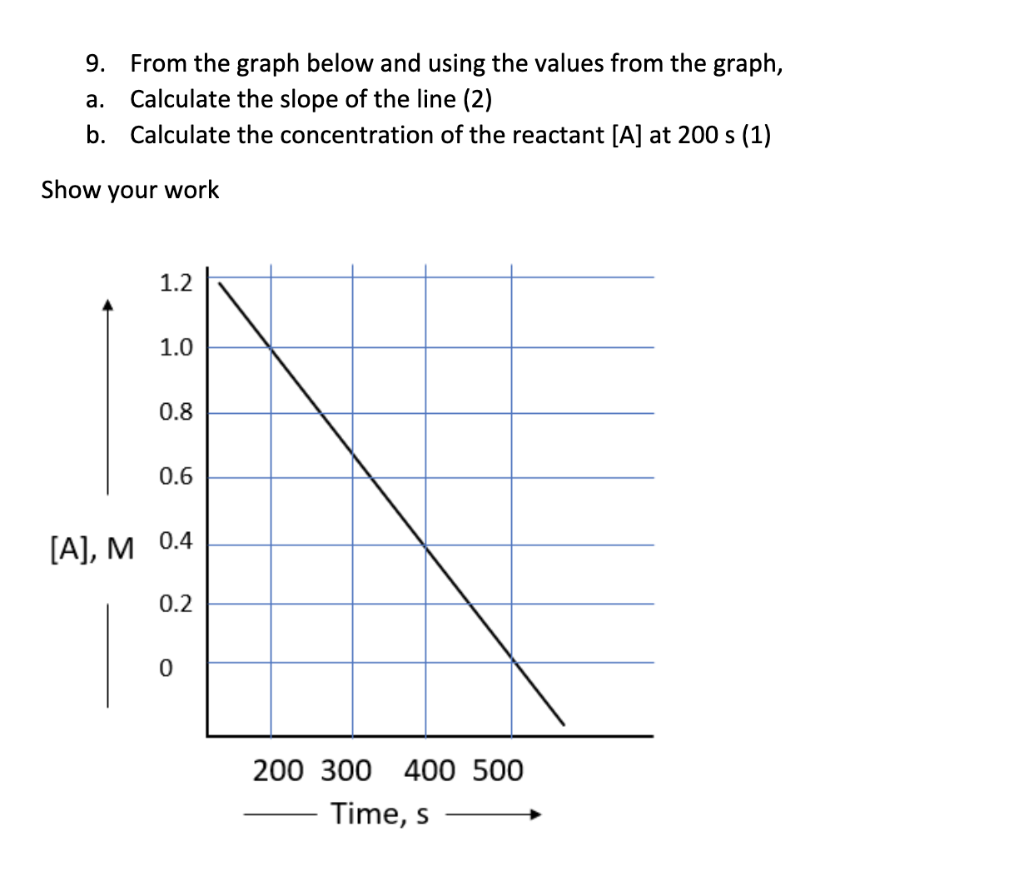
9. From the graph below and using the values from the graph, a. Calculate the slope of the line (2) b. Calculate the concentration of
Step by Step Solution
There are 3 Steps involved in it
Step: 1

Get Instant Access to Expert-Tailored Solutions
See step-by-step solutions with expert insights and AI powered tools for academic success
Step: 2

Step: 3
Ace Your Homework with AI
Get the answers you need in no time with our AI-driven, step-by-step assistance
Get Started
Organic Chemistry
Authors: Marc Loudon
5th edition
981519431, 978-0981519449, 098151944X, 978-0-98151943, 978-0981519432