Answered step by step
Verified Expert Solution
Question
1 Approved Answer
9. How would the graphs of your discharging capacitor look if you plotted the natural logarithm the potential across the capacitor versus time? If

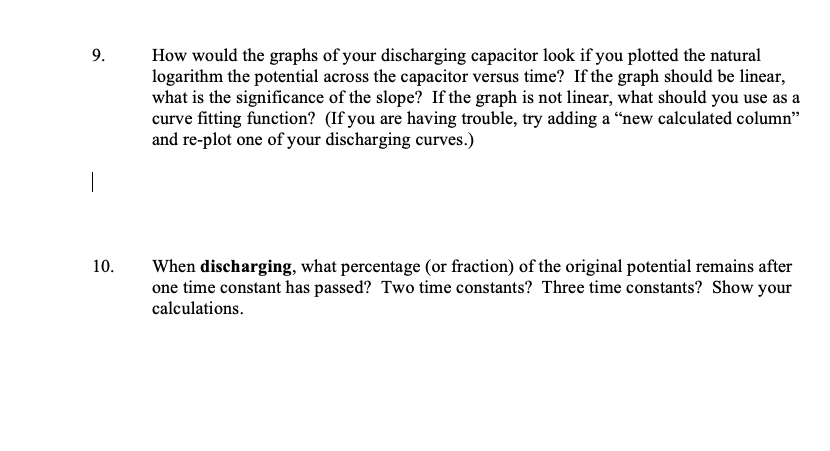
9. How would the graphs of your discharging capacitor look if you plotted the natural logarithm the potential across the capacitor versus time? If the graph should be linear, what is the significance of the slope? If the graph is not linear, what should you use as a curve fitting function? (If you are having trouble, try adding a new calculated column" and re-plot one of your discharging curves.) 10. When discharging, what percentage (or fraction) of the original potential remains after one time constant has passed? Two time constants? Three time constants? Show your calculations.
Step by Step Solution
There are 3 Steps involved in it
Step: 1

Get Instant Access to Expert-Tailored Solutions
See step-by-step solutions with expert insights and AI powered tools for academic success
Step: 2

Step: 3

Ace Your Homework with AI
Get the answers you need in no time with our AI-driven, step-by-step assistance
Get Started


