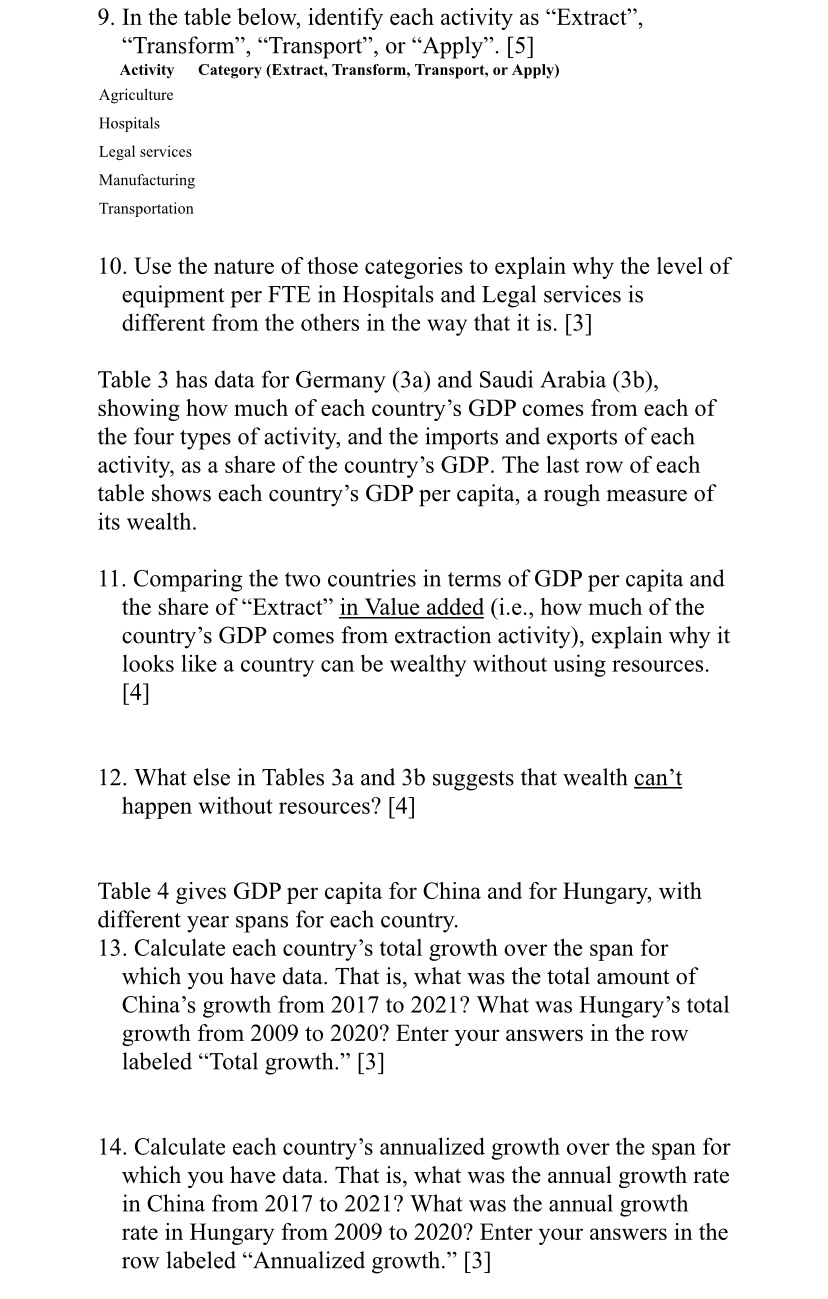
9. In the table below, identify each activity as Extract, TransformECON 102 Quizam 1, home part Submit by 8:303:11, Feb. 211't 1. Dene capital as
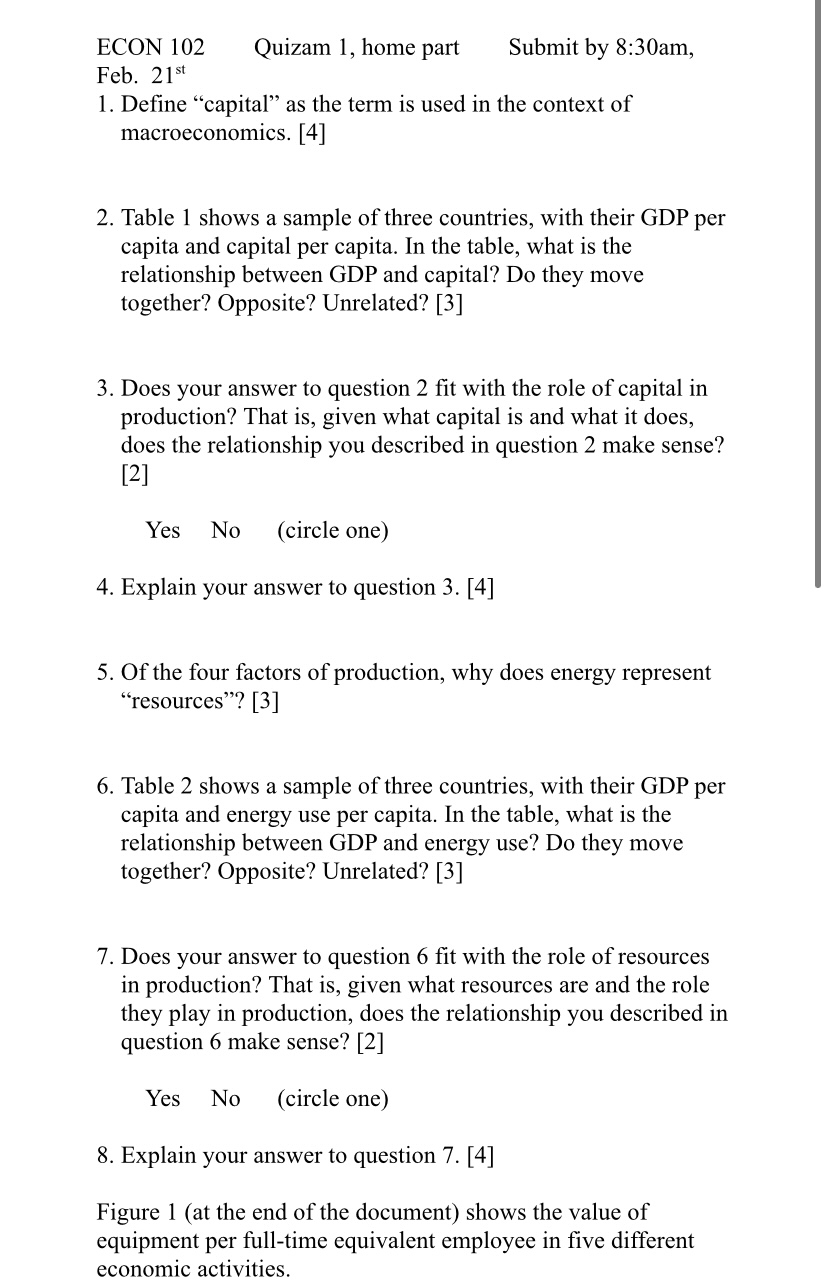
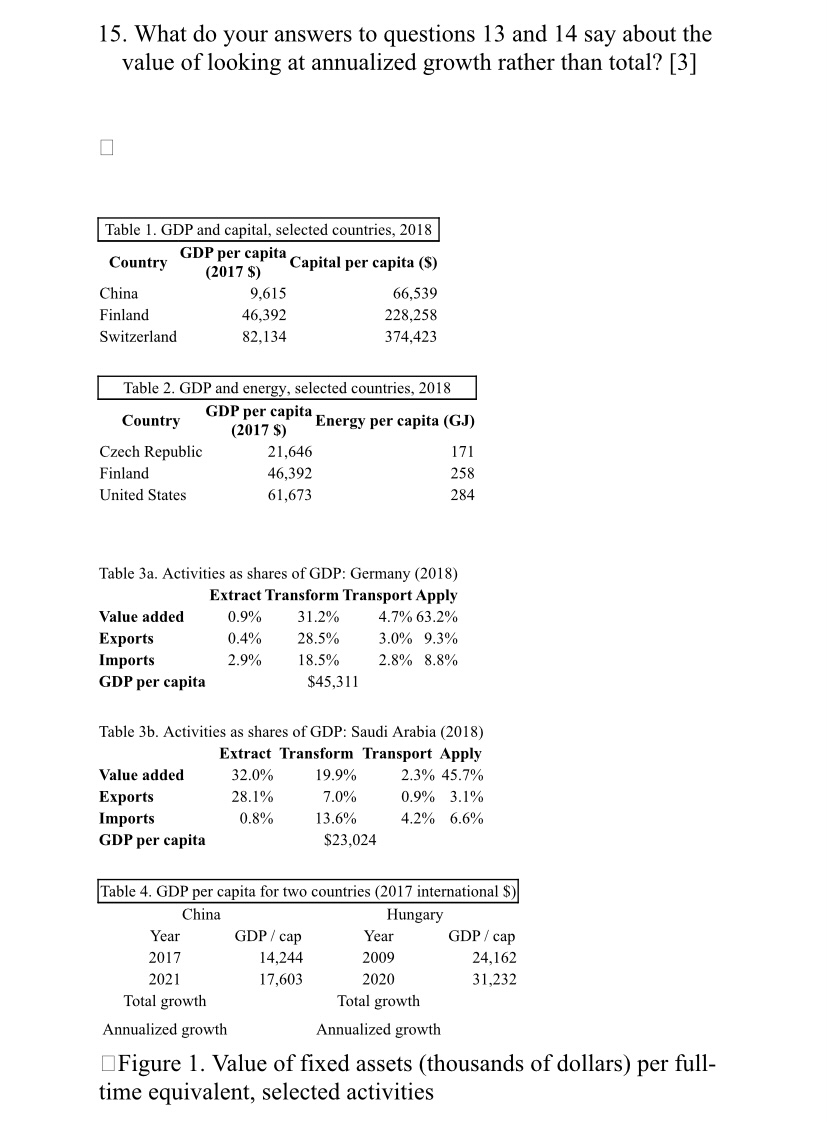
9. In the table below, identify each activity as \"Extract", \"Transform\ECON 102 Quizam 1, home part Submit by 8:303:11, Feb. 211't 1. Dene \"capital" as the term is used in the context of macroeconomics. [4] 2. Table 1 shows a sample ofthree countries, with their GDP per capita and capital per capita. In the table, what is the relationship between GDP and capital? Do they move together? Opposite? Unrelated? [3] 3. Does your answer to question 2 fit with the role of capital in production? That is, given what capital is and what it does, does the relationship you described in question 2 make sense? [2] Yes No (circle one) 4. Explain your answer to question 3. [4] 5. 0f the four factors of production, why does energy represent \"resources\"? [3] 6. Table 2 shows a sample of three countries, with their GDP per capita and energy use per capita. In the table, what is the relationship between GDP and energy use? Do they move together? Opposite? Unrelated? [3] 7. Does your answer to question 6 t with the role of resources in production? That is, given what resources are and the role they play in production, does the relationship you described in question 6 make sense? [2] Yes No (circle one) 8. Explain your answer to question 7. [4] Figure l (at the end of the document) shows the value of equipment per full-time equivalent employee in ve different economic activities. 15. What do your answers to questions 13 and 14 say about the value of looking at annualized growth rather than total? [3] 0 Table 1. GDP and capital, selected countries, 2018 Country GDP per capita Capital per capita ($) (2017 $) China 9,615 66,539 Finland 46,392 228,258 Switzerland 82,134 374,423 Table 2. GDP and energy, selected countries, 2018 Country GDP per capita (2017 $) Energy per capita (GJ) Czech Republic 21,646 171 Finland 46,392 258 United States 61,673 284 Table 3a. Activities as shares of GDP: Germany (2018) Extract Transform Transport Apply Value added 0.9% 31.2% 4.7% 63.2% Exports 0.4% 28.5% 3.0% 9.3% Imports 2.9% 18.5% 2.8% 8.8% GDP per capita $45,311 Table 3b. Activities as shares of GDP: Saudi Arabia (2018) Extract Transform Transport Apply Value added 32.0% 19.9% 2.3% 45.7% Exports 28.1% 7.0% 0.9% 3.1% Imports 0.8% 13.6% 4.2% 6.6% GDP per capita $23,024 Table 4. GDP per capita for two countries (2017 international $) China Hungary Year GDP / cap Year GDP / cap 2017 14,244 2009 24,162 2021 17,603 2020 31,232 Total growth Total growth Annualized growth Annualized growth Figure 1. Value of fixed assets (thousands of dollars) per full- time equivalent, selected activities
Step by Step Solution
There are 3 Steps involved in it
Step: 1
Get Instant Access to Expert-Tailored Solutions
See step-by-step solutions with expert insights and AI powered tools for academic success
Step: 2
Step: 3
Ace Your Homework with AI
Get the answers you need in no time with our AI-driven, step-by-step assistance