

Answered step by step
Verified Expert Solution
Question
1 Approved Answer
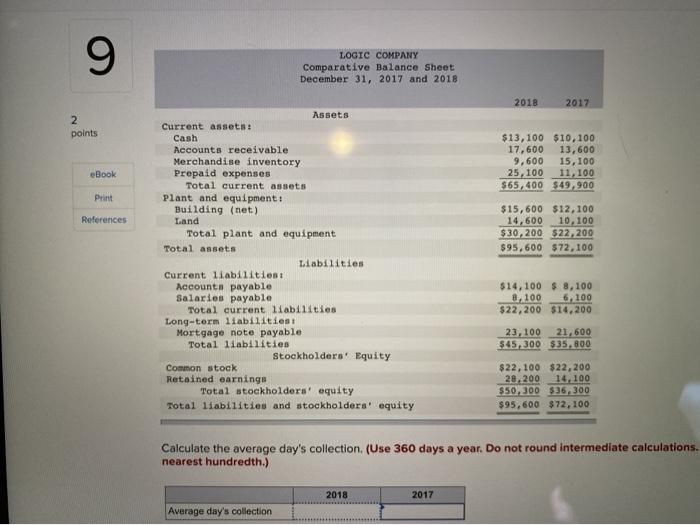
9 LOGIC COMPANY Comparative Balance Sheet December 31, 2017 and 2018 2018 2017 2 points $13,100 $10,100 17,600 13,600 9,600 15,100 25, 100 11,100 $65,400
Step by Step Solution
There are 3 Steps involved in it
Step: 1

Get Instant Access to Expert-Tailored Solutions
See step-by-step solutions with expert insights and AI powered tools for academic success
Step: 2

Step: 3
Ace Your Homework with AI
Get the answers you need in no time with our AI-driven, step-by-step assistance
Get Started
Management And Cost Accounting Student Manual Free Tracked Delivery
Authors: Colin Drury, Mike Tayles
1st Edition
9781473773622