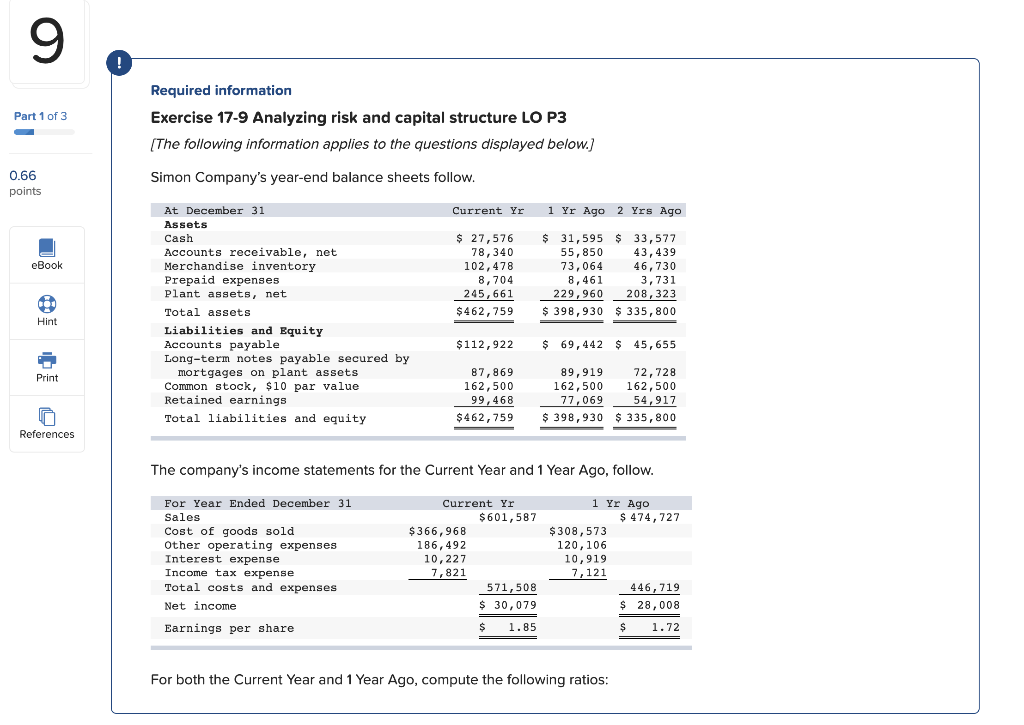
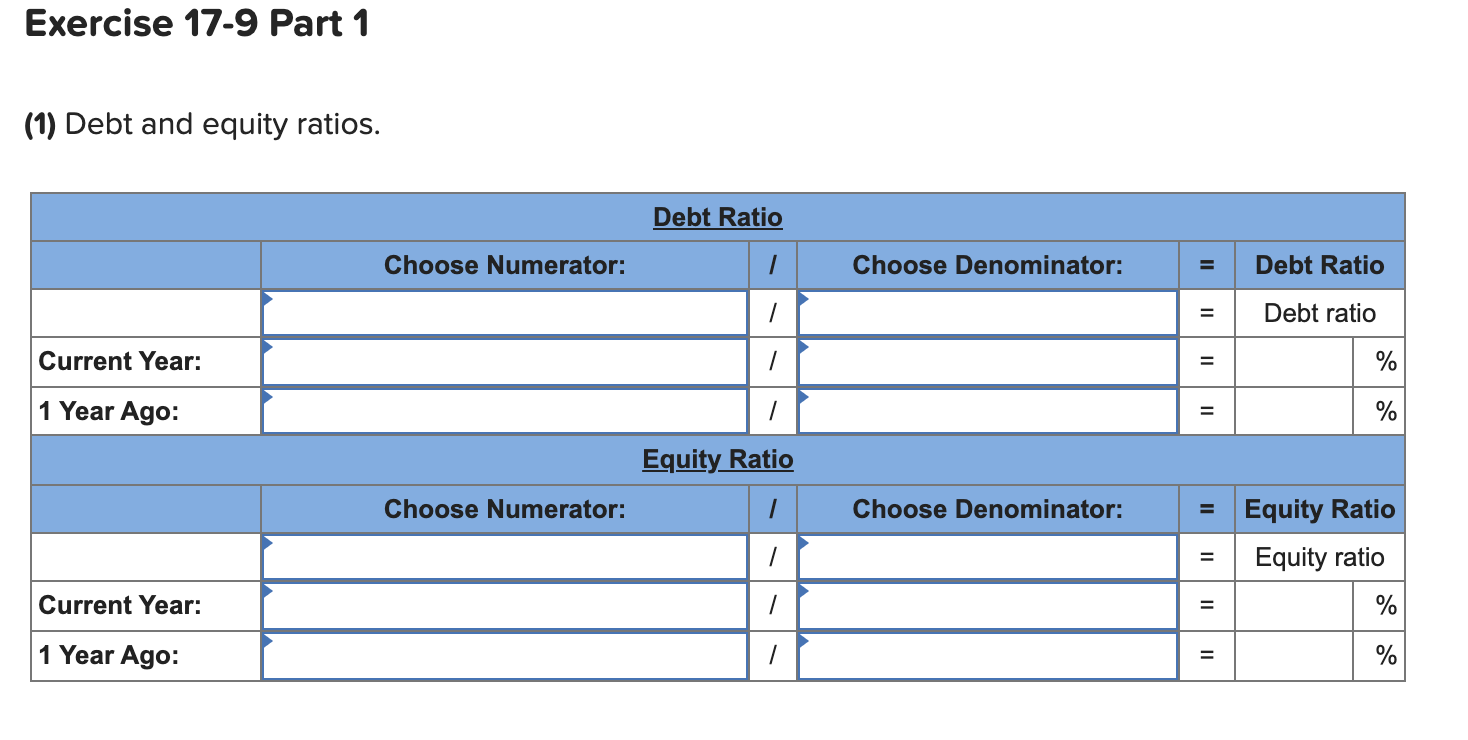
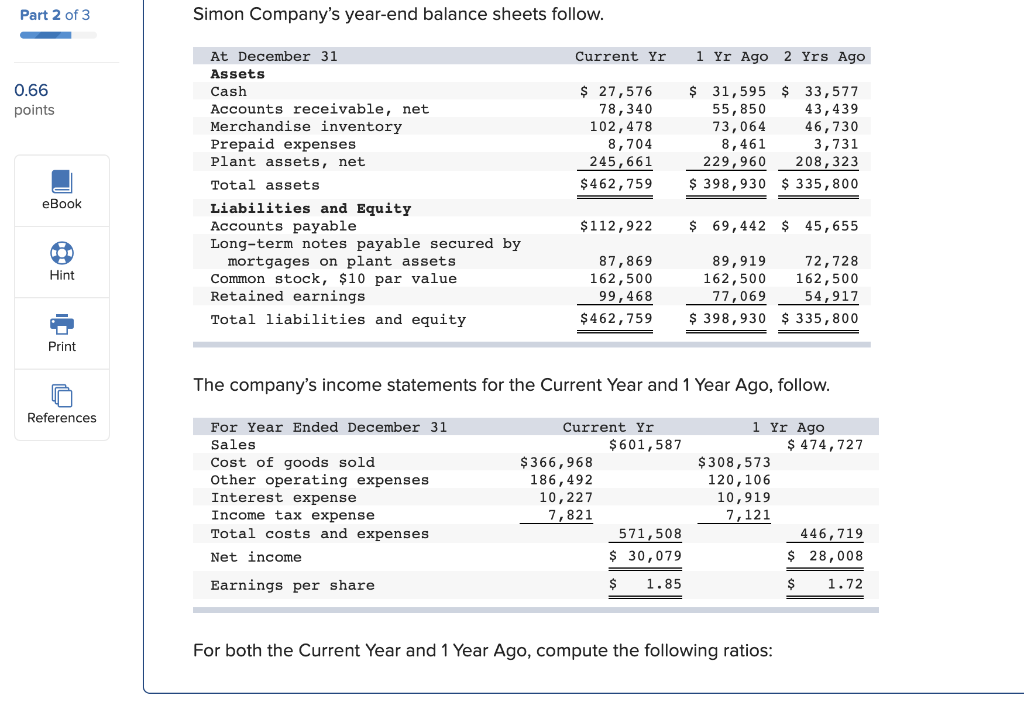
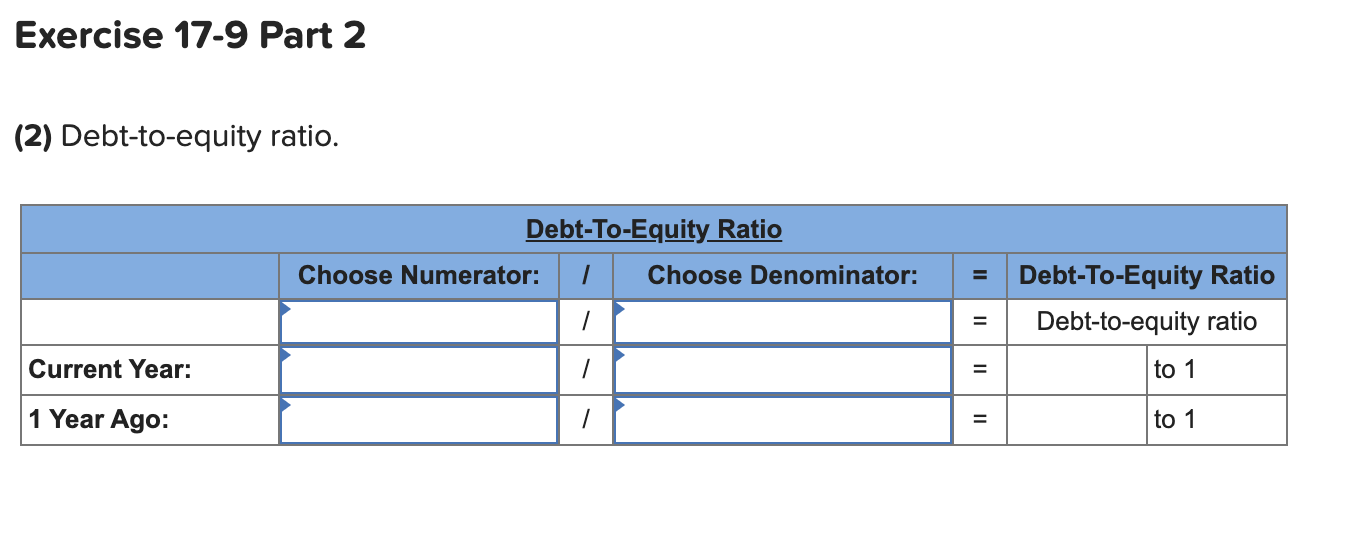
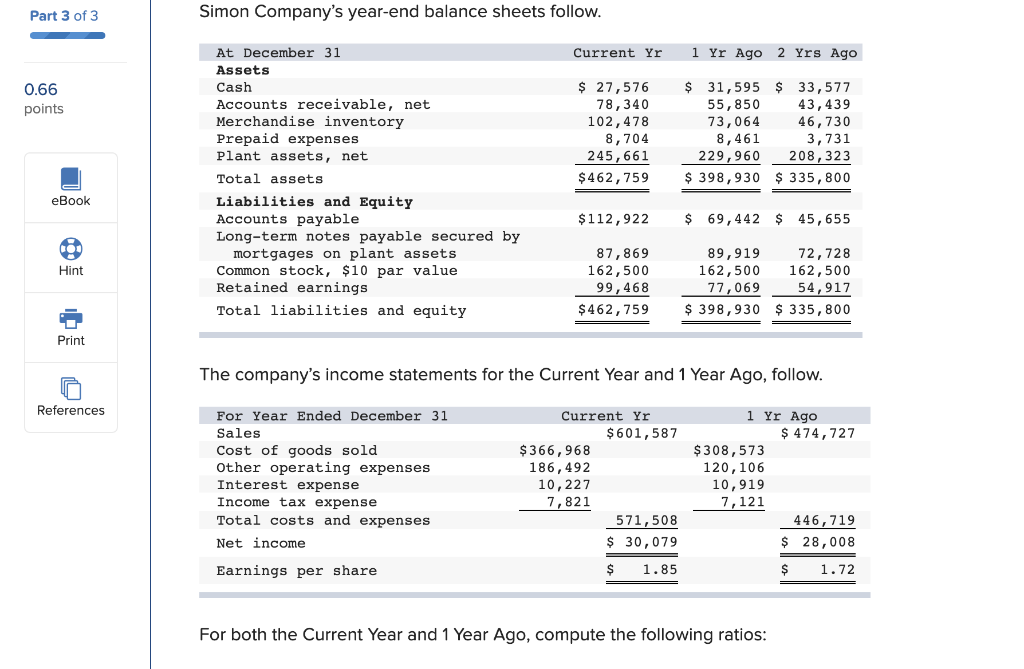
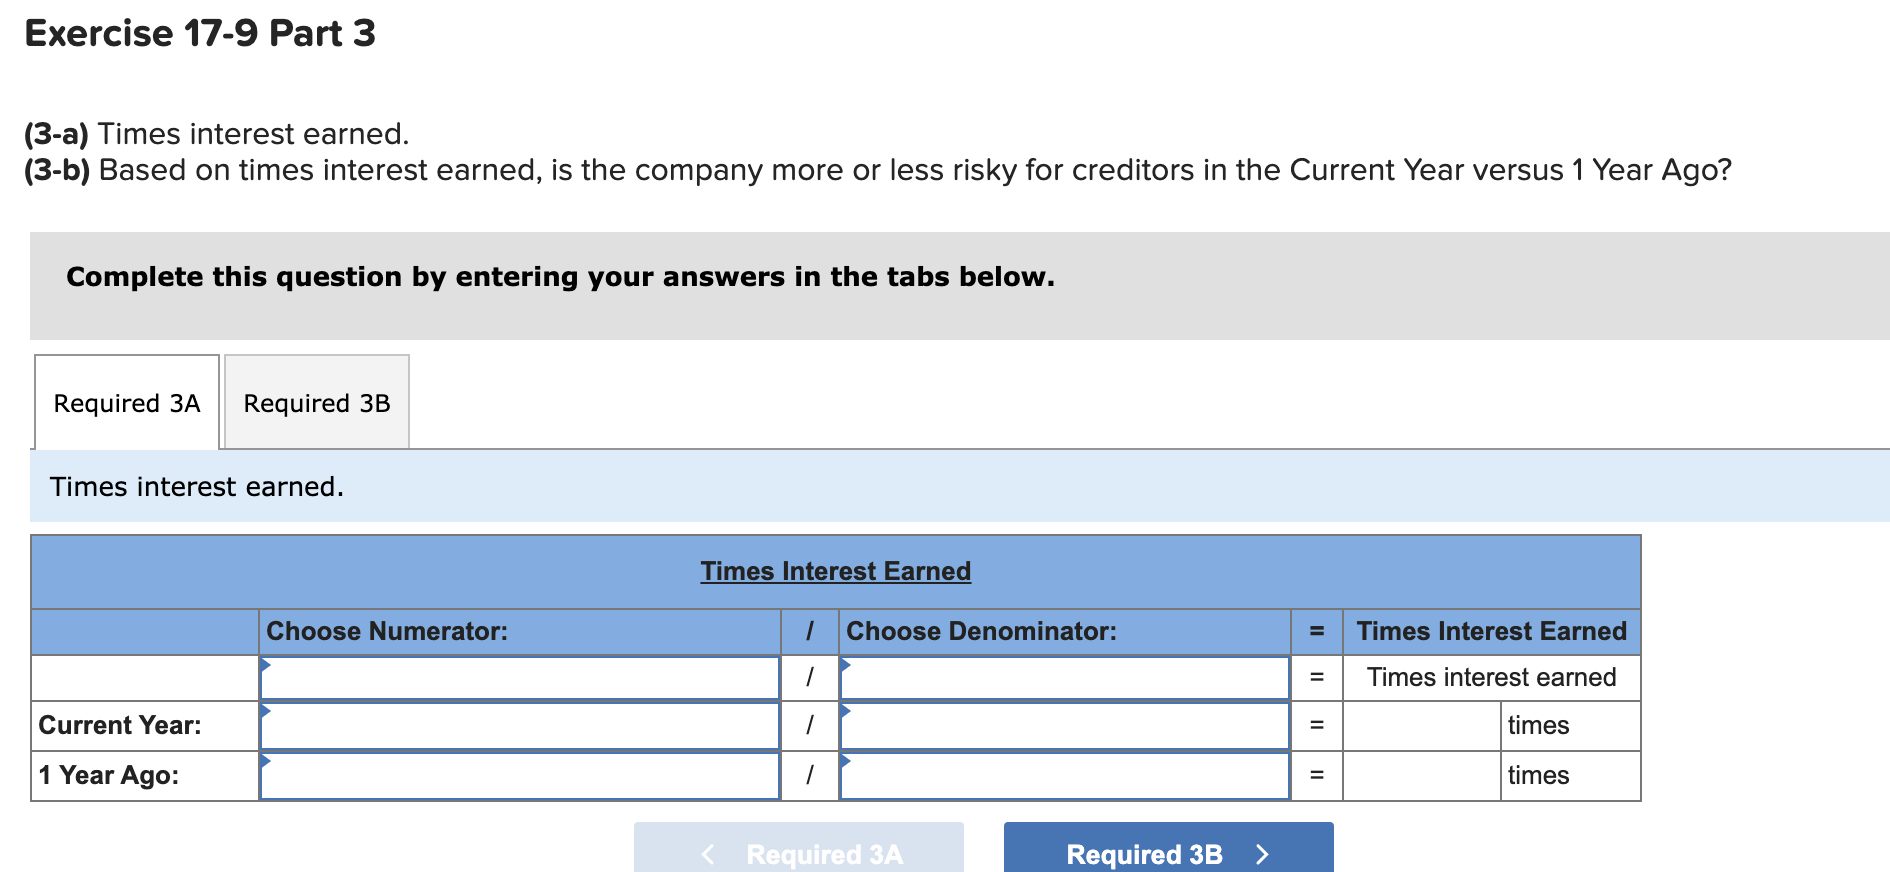
9 Part 1 of 3 Required information Exercise 17-9 Analyzing risk and capital structure LO P3 (The following information applies to the questions displayed below.) Simon Company's year-end balance sheets follow. 0.66 points Current Yr 1 Yr Ago 2 Yrs Ago eBook At December 31 Assets Cash Accounts receivable, net Merchandise inventory Prepaid expenses Plant assets, net Total assets Liabilities and Equity Accounts payable Long-term notes payable secured by mortgages on plant assets Common stock, $10 par value Retained earnings Total liabilities and equity $ 27,576 78, 340 102,478 8,704 245, 661 $ 462,759 $ 31,595 $ 33,577 55,850 43, 439 73,064 46,730 8,461 3,731 229,960 208, 323 $ 398,930 $ 335,800 Hint $112,922 $ 69,442 $ 45,655 . Print 87,869 162,500 99,468 $462,759 89,919 72,728 162,500 162,500 77,069 54,917 $ 398,930 $ 335,800 References The company's income statements for the Current Year and 1 Year Ago, follow. For Year Ended December 31 Sales Cost of goods sold Other operating expenses Interest expense Income tax expense Total costs and expenses Net income Earnings per share Current Yr $601,587 $366,968 186,492 10,227 7,821 571,508 $ 30,079 1 Yr Ago $ 474,727 $308,573 120, 106 10,919 7, 121 446,719 $ 28,008 $ 1.85 $ 1.72 For both the Current Year and 1 Year Ago, compute the following ratios: Exercise 17-9 Part 1 (1) Debt and equity ratios. Debt Ratio Choose Numerator: Choose Denominator: Debt Ratio = Debt ratio Current Year: Il % 1 Year Ago: = % Equity Ratio Choose Numerator: Choose Denominator: Equity Ratio Equity ratio Current Year: II % 1 Year Ago: % Part 2 of 3 Simon Company's year-end balance sheets follow. Current Yr 1 Yr Ago 2 Yrs Ago 0.66 points At December 31 Assets Cash Accounts receivable, net Merchandise inventory Prepaid expenses Plant assets, net Total assets Liabilities and Equity Accounts payable Long-term notes payable secured by mortgages on plant assets Common stock, $10 par value Retained earnings Total liabilities and equity $ 27,576 78, 340 102, 478 8,704 245, 661 $ 462,759 $ 31,595 $ 33,577 55,850 43, 439 73,064 46,730 8, 461 3,731 229, 960 208, 323 $ 398,930 $ 335,800 eBook $112,922 $ 69,442 $ 45,655 Hint 87,869 162,500 99,468 $ 462,759 89,919 72,728 162,500 162,500 77,069 54,917 $ 398,930 $ 335,800 Print The company's income statements for the Current Year and 1 Year Ago, follow. De References For Year Ended December 31 Sales Cost of goods sold Other operating expenses Interest expense Income tax expense Total costs and expenses Net income Current Yr $601,587 $36 186,492 10,227 7,821 571,508 $ 30,079 1 Yr Ago $ 474,727 $308,573 120, 106 10,919 7,121 446,719 $ 28,008 Earnings per share $ 1.85 $ 1.72 For both the Current Year and 1 Year Ago, compute the following ratios: Exercise 17-9 Part 2 (2) Debt-to-equity ratio. Debt-To-Equity Ratio Choose Numerator: Choose Denominator: Debt-To-Equity Ratio Debt-to-equity ratio to 1 Current Year: 1 1 1 Year Ago: to 1 Part 3 of 3 Simon Company's year-end balance sheets follow. Current Yr 1 Yr Ago 2 Yrs Ago 0.66 points At December 31 Assets Cash Accounts receivable, net Merchandise inventory Prepaid expenses Plant assets, net Total assets Liabilities and Equity Accounts payable Long-term notes payable secured by mortgages on plant assets Common stock, $10 par value Retained earnings Total liabilities and equity $ 27,576 78,340 102,478 8,704 245, 661 $ 462,759 $ 31,595 $ 33,577 55,850 43, 439 73,064 46,730 3,731 229,960 208, 323 $ 398,930 $ 335,800 8,461 eBook $112,922 $ 69,442 $ 45,655 et Hint 87,869 162,500 99,468 $462,759 89,919 72,728 162,500 162,500 77,069 54,917 $ 398,930 $ 335,800 Print The company's income statements for the Current Year and 1 Year Ago, follow. References For Year Ended December 31 Sales Cost of goods sold Other operating expenses Interest expense Income tax expense Total costs and expenses Net income Earnings per share Current Yr $601,587 $366,968 186, 492 10,227 7,821 571,508 $ 30,079 1 Yr Ago $ 474,727 $308,573 120,106 10,919 7,121 446,719 $ 28,008 $ 1.85 $ 1.72 For both the Current Year and 1 Year Ago, compute the following ratios: Exercise 17-9 Part 3 (3-a) Times interest earned. (3-b) Based on times interest earned, is the company more or less risky for creditors in the Current Year versus 1 Year Ago? Complete this question by entering your answers in the tabs below. Required 3A Required 3B Times interest earned. Times Interest Earned Choose Numerator: Choose Denominator: Times Interest Earned Times interest earned Current Year: / II times 1 Year Ago: times Required 3A Required 3B Based on times interest earned, is the company more or less risky for creditors in the Current Year versus 1 Year Ago? Times interest earned Required 3A Required 3B