Answered step by step
Verified Expert Solution
Link Copied!

Question

1 Approved Answer

9. Tabular and graphical presentation terms For each definition, fill in the box with the correct term. (Note: These are all basic terms used when
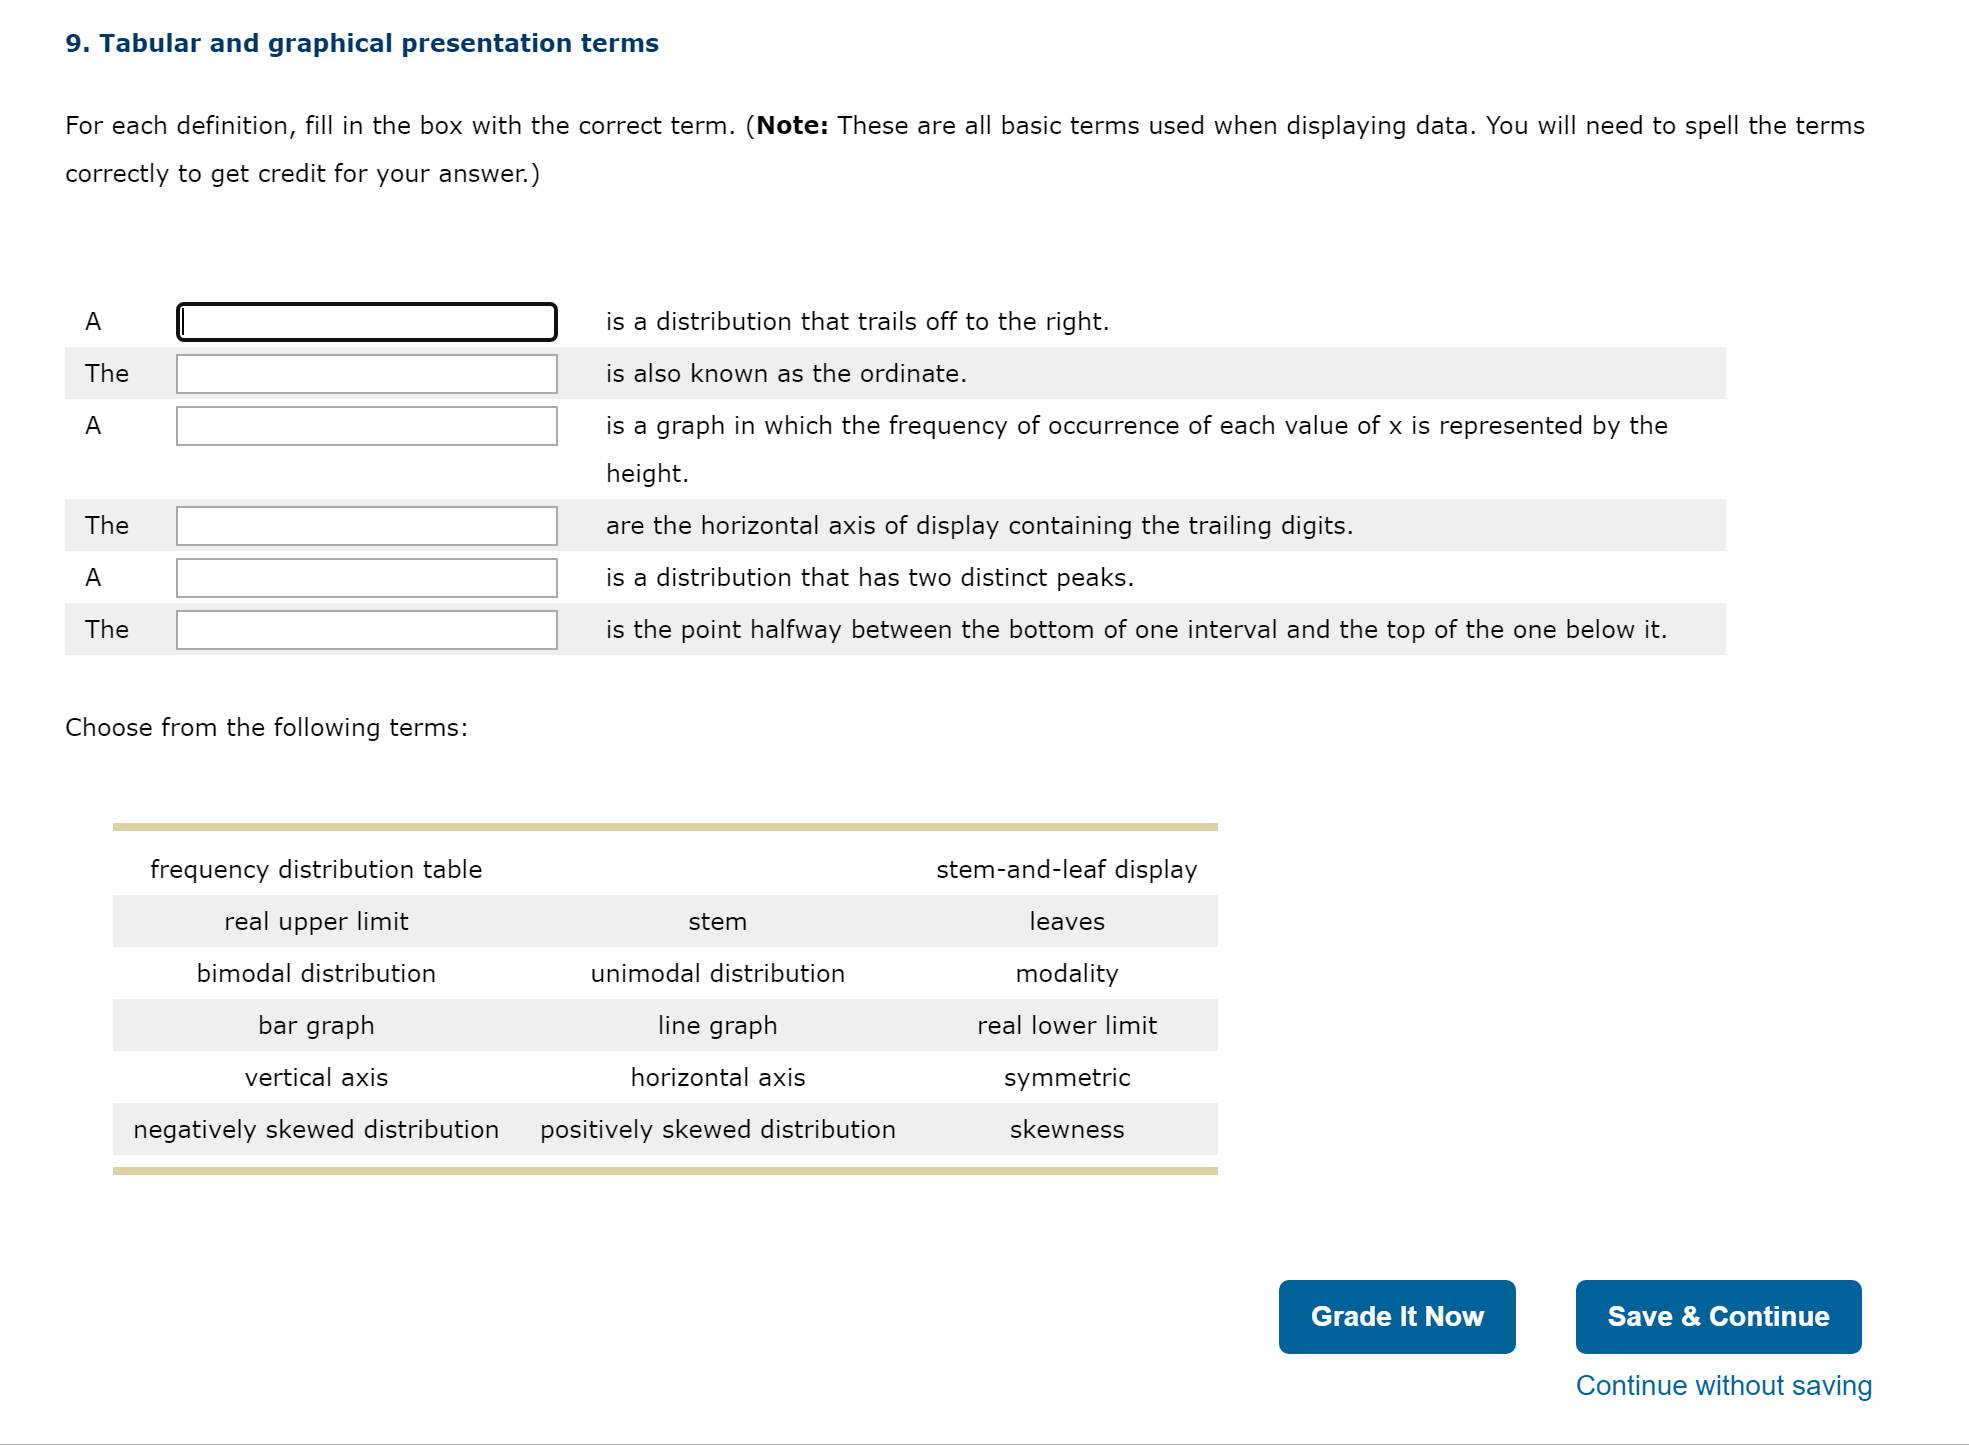
image text in transcribed
9. Tabular and graphical presentation terms For each definition, fill in the box with the correct term. (Note: These are all basic terms used when displaying data. You will need to spell the terms correctly to get credit for your answer.) A :1 The The The Choose from the following terms: frequency distribution table real upper limit bimodal distribution bar graph vertical axis negatively skewed distribution is a distribution that trails off to the right. is also known as the ordinate. is a graph in which the frequency of occurrence of each value of x is represented by the height. are the horizontal axis of display containing the trailing digits. is a distribution that has two distinct peaks. is the point halfway between the bottom of one interval and the top of the one below it. stem unimodal distribution line graph horizontal axis positively skewed distribution stem-andleaf display leaves modality real lower limit symmetric skewness Grade It Now Save & Continue Continue without saving

Step by Step Solution

There are 3 Steps involved in it

Step: 1

blur-text-image

Get Instant Access to Expert-Tailored Solutions

See step-by-step solutions with expert insights and AI powered tools for academic success

Step: 2

blur-text-image_2

Step: 3

blur-text-image_3

Ace Your Homework with AI

Get the answers you need in no time with our AI-driven, step-by-step assistance

Get Started

Recommended Textbook for

An Introduction to the Mathematics of financial Derivatives

Authors: Salih N. Neftci

2nd Edition

978-0125153928, 9780080478647, 125153929, 978-0123846822

More Books

Students also viewed these Mathematics questions