

Answered step by step
Verified Expert Solution
Question
1 Approved Answer
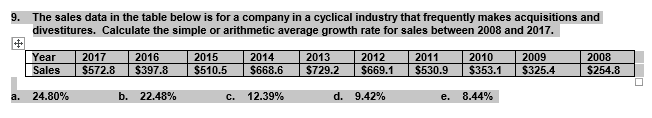
9. The sales data in the table below is for a company in a cyclical industry that frequently makes acquisitions and divestitures. Calculate the simple
Step by Step Solution
There are 3 Steps involved in it
Step: 1

Get Instant Access to Expert-Tailored Solutions
See step-by-step solutions with expert insights and AI powered tools for academic success
Step: 2

Step: 3
Ace Your Homework with AI
Get the answers you need in no time with our AI-driven, step-by-step assistance
Get Started
How To Analyse Bank Financial Statements
Authors: Thomas Padberg
1st Edition
0857195182, 978-0857195180