

Answered step by step
Verified Expert Solution
Question
1 Approved Answer
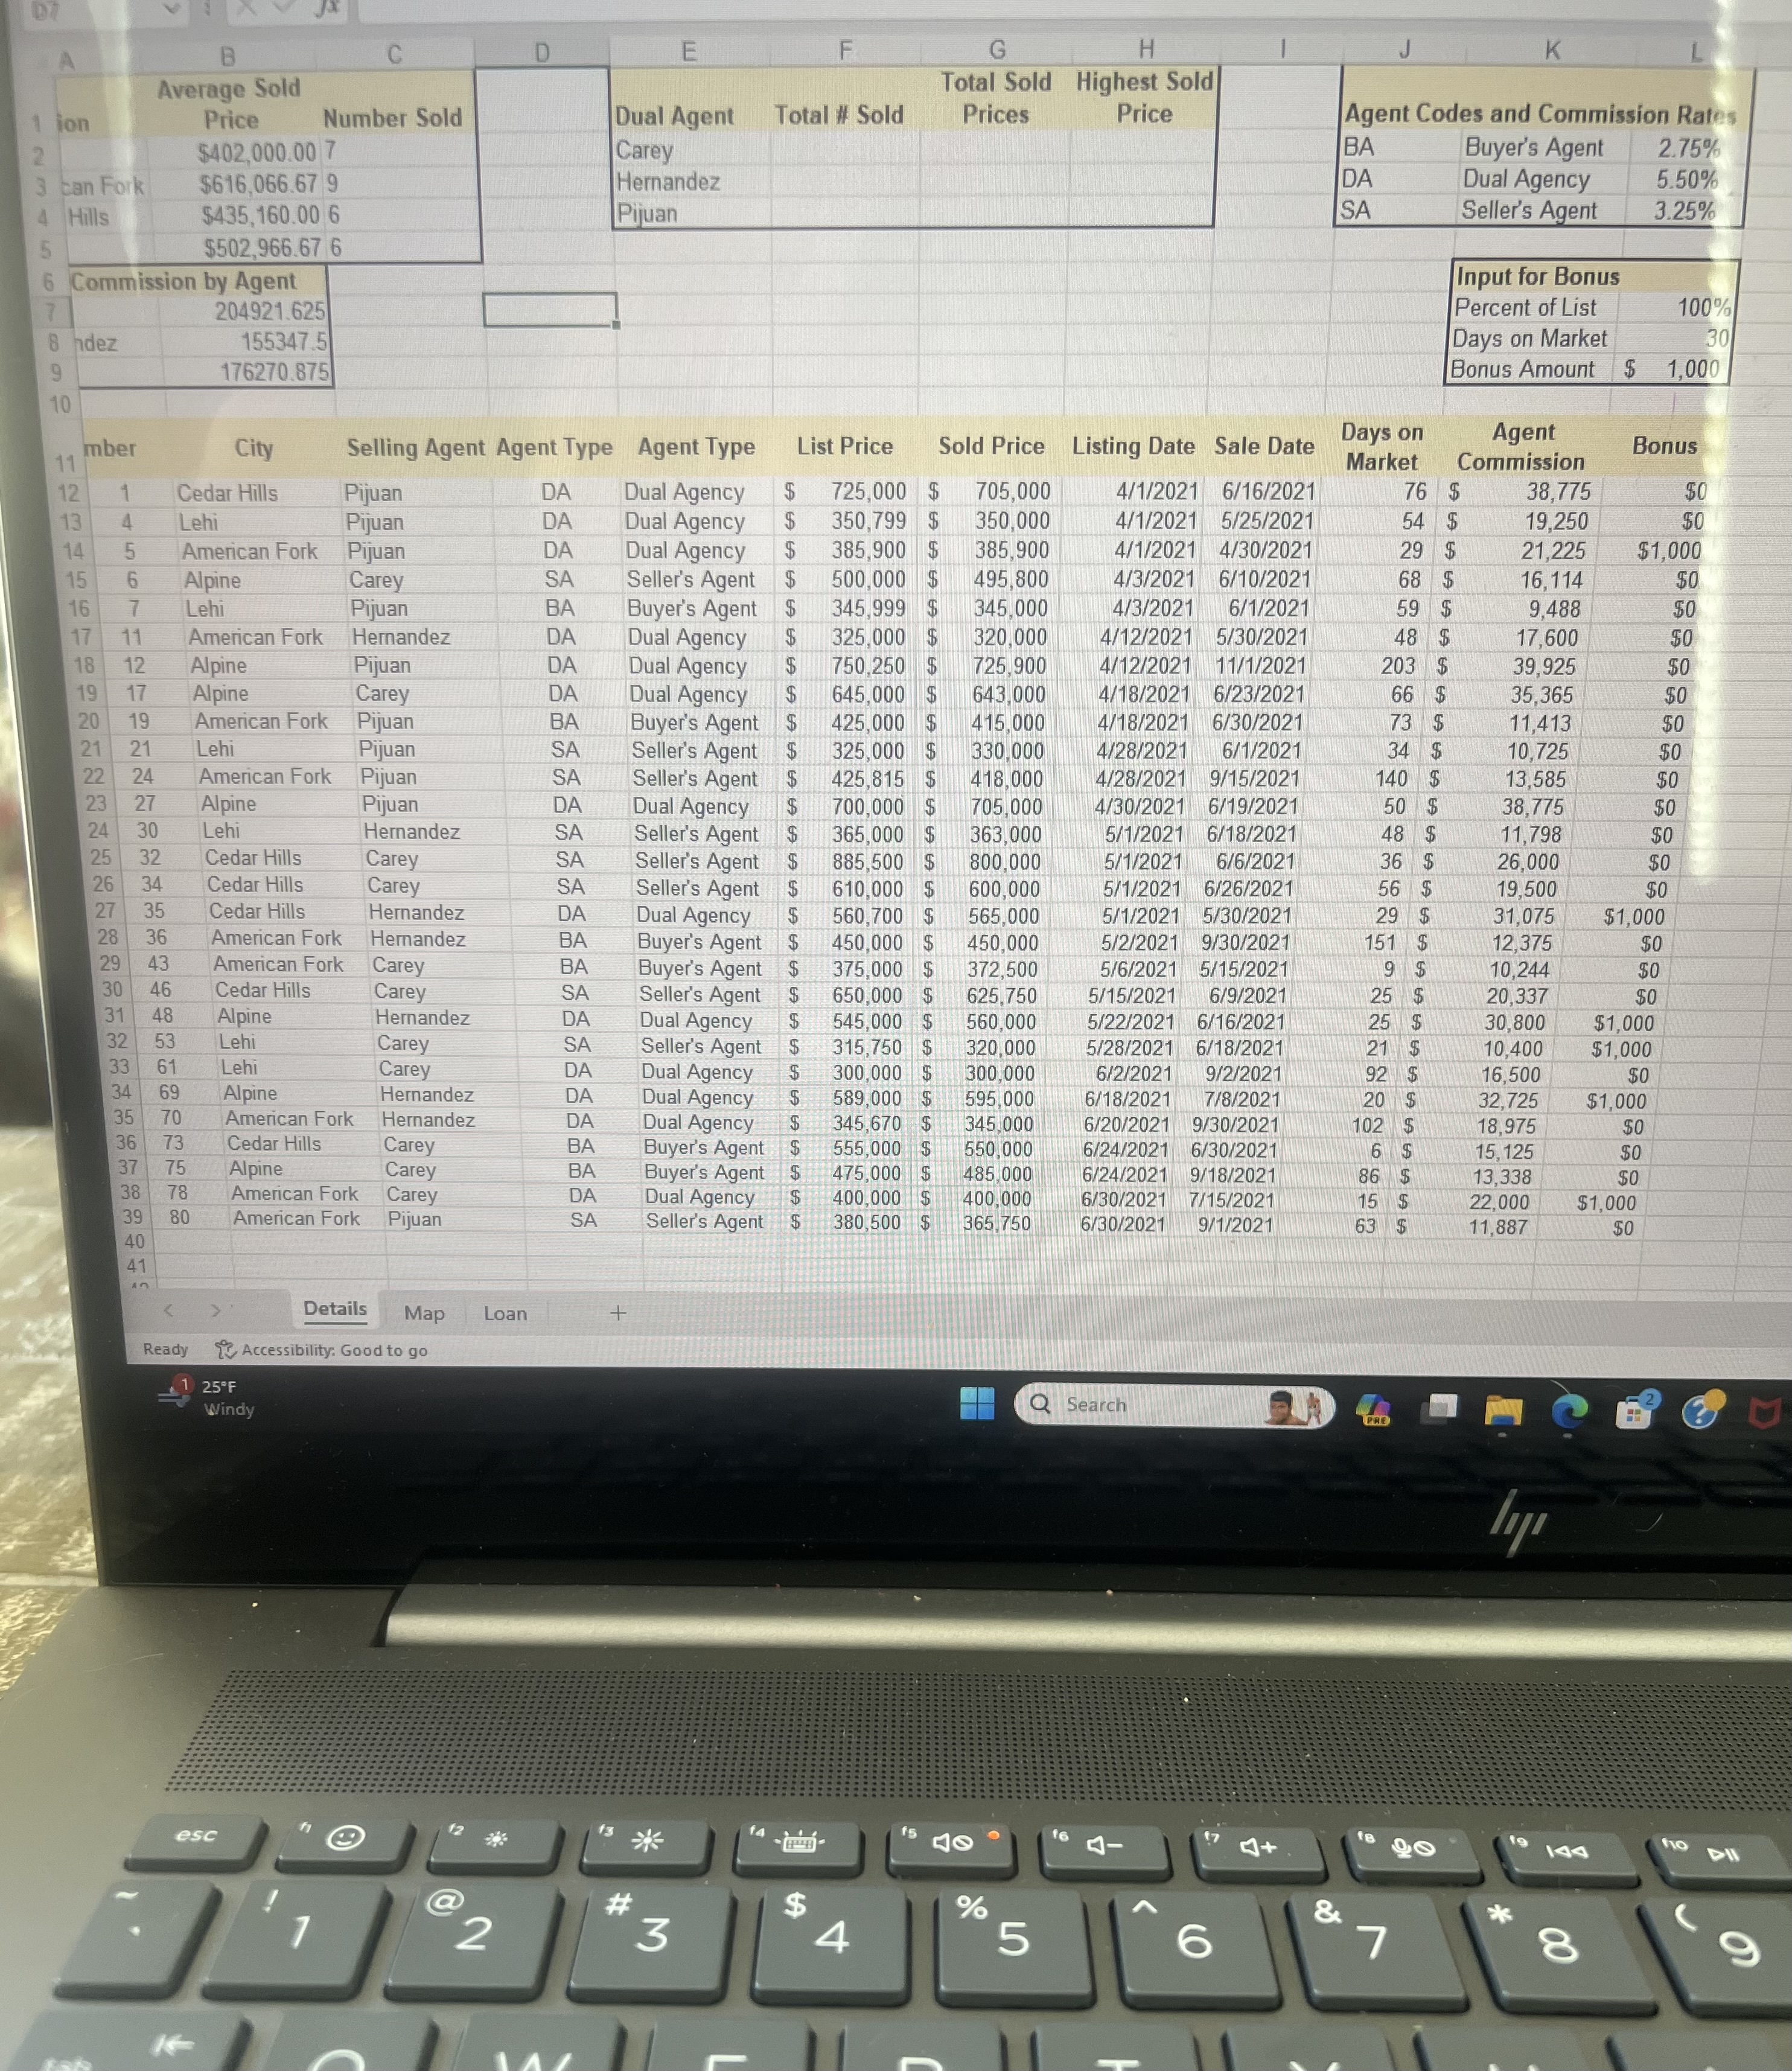
9 The top - middle section of the spreadsheet is designed for summary statistics for multiple conditions. You will calculate the number of houses sold
The topmiddle section of the spreadsheet is designed for summary statistics for multiple conditions. You will calculate the number of houses sold for each agent when he or she served as a Dual Agent DA Use mixed references for ranges and the agent code condition in cell J Use relative cell references to the agent condition in cell E When you copy the formulas, use the paste Formulas options to preserve border formatting.
In cell F insert the COUNTIFS function in cell F to count the number of houses sold by the first agent cell E who was a Dual Agent DAJ for that house. Use all cell references in the function. Copy the function to the range F:F and preserve the bottom border for cell F
You are ready to calculate the total value of those houses for each agent when he or she served as a Dual Agent DA Use mixed references for ranges and the agent code condition in cell J Use relative cell references to the agent condition in cell E When you copy the formulas, use the paste Formulas options to preserve border formatting.
In cell G insert the SUMIFS function to sum the selling prices of the houses sold by the first agent cell E who was a Dual Agent DAJ for that house. Copy the function to the range G:G and preserve the bottom border for cell G
Now, you will calculate the highestprice house highestprice house sold for each agent when he or she served as a Dual Agent DA Use mixed references for ranges and the agent code condition in cell J Use relative cell references to the agent condition in cell E When you copy the formulas, use the paste Formulas options to preserve border formatting.
In cell insert the MAXIFS function in cell to display the highestprice house sold by the first agent cell E who was a Dual Agent DAJ for that house. Copy the function to the range : and preserve the borders in the range :
The Map worksheet contains a list of cities, postal codes, and average house sales. You will insert a map chart to depict the averages visually using the default gradient fill colors.
Display the Map worksheet, select the range BC and insert a map chart.
Hint The Insert tab contains the option to insert a map.
Created On:
ExpExcelChCap Real Est
Step by Step Solution
There are 3 Steps involved in it
Step: 1

Get Instant Access to Expert-Tailored Solutions
See step-by-step solutions with expert insights and AI powered tools for academic success
Step: 2

Step: 3
Ace Your Homework with AI
Get the answers you need in no time with our AI-driven, step-by-step assistance
Get Started
Genomes Browsers And Databases Data Mining Tools For Integrated Genomic Databases
Authors: Peter Schattner
1st Edition
0521711320, 978-0521711326