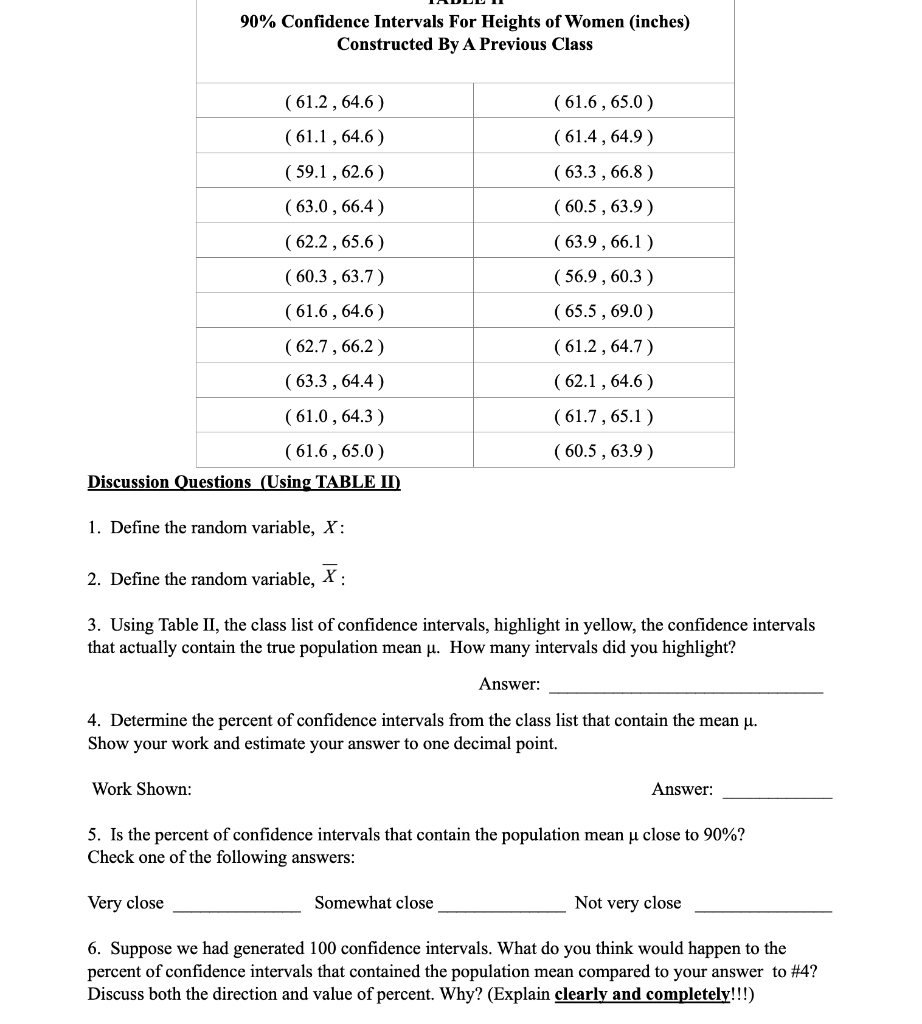
90% Confidence Intervals For Heights of Women (inches) Constructed By A Previous Class (61.2, 64.6) (61.1, 64.6) ( 59.1, 62.6) (63.0, 66.4) (62.2, 65.6) (60.3, 63.7) (61.6, 64.6) (62.7, 66.2) (63.3, 64.4) (61.0, 64.3 ) (61.6, 65.0) Discussion Questions (Using TABLE II) (61.6, 65.0) (61.4, 64.9) (63.3, 66.8) ( 60.5, 63.9) (63.9, 66.1) ( 56.9, 60.3) ( 65.5, 69.0) (61.2 , 64.7) (62.1, 64.6) (61.7, 65.1) ( 60.5, 63.9) 1. Define the random variable, X: 2. Define the random variable, X : 3. Using Table II, the class list of confidence intervals, highlight in yellow, the confidence intervals that actually contain the true population mean u. How many intervals did you highlight? Answer: 4. Determine the percent of confidence intervals from the class list that contain the mean u. Show your work and estimate your answer to one decimal point. Work Shown: Answer: 5. Is the percent of confidence intervals that contain the population mean u close to 90%? Check one of the following answers: Very close Somewhat close Not very close 6. Suppose we had generated 100 confidence intervals. What do you think would happen to the percent of confidence intervals that contained the population mean compared to your answer to #4? Discuss both the direction and value of percent. Why? (Explain clearly and completely!!!) 7. When we construct a 90% confidence interval, we say that we are 90% confident that the true population mean lies within the confidence interval. Using complete sentences, explain what we mean by this phrase clearly and completely. 8. Some students think that a 90% confidence interval contains 90% of the original data. a) Go back to TABLE I and highlight in yellow each of the 100 women's heights that lie within the confidence interval that you generated. Count the number of heights that you highlighted. Number of 100 women's heights that lie within YOUR confidence interval b) What percent of the 100 women's heights, to one decimal place, is this? c) Is this percent close to 90%? Check off your answer. Very close Somewhat close Not very close 9. The symbol for the random variable used as the basis to create your confidence interval is: 10. Explain clearly and completely why it does not make sense to count original data values that lie in a confidence interval. Think about the definition of the random variable that is being used in the problem? This is the heart of this lab project. Be thoughtful in your response! Include the symbol for and a discussion about the random variable being used for this problem. 11. Suppose you obtained the heights of 10 women and calculated a confidence interval from this information. Without knowing the population mean u, would you have any way of knowing for certain if your interval actually contained the value of u? Why or why not? Explain your answer clearly and completely. 90% Confidence Intervals For Heights of Women (inches) Constructed By A Previous Class (61.2, 64.6) (61.1, 64.6) ( 59.1, 62.6) (63.0, 66.4) (62.2, 65.6) (60.3, 63.7) (61.6, 64.6) (62.7, 66.2) (63.3, 64.4) (61.0, 64.3 ) (61.6, 65.0) Discussion Questions (Using TABLE II) (61.6, 65.0) (61.4, 64.9) (63.3, 66.8) ( 60.5, 63.9) (63.9, 66.1) ( 56.9, 60.3) ( 65.5, 69.0) (61.2 , 64.7) (62.1, 64.6) (61.7, 65.1) ( 60.5, 63.9) 1. Define the random variable, X: 2. Define the random variable, X : 3. Using Table II, the class list of confidence intervals, highlight in yellow, the confidence intervals that actually contain the true population mean u. How many intervals did you highlight? Answer: 4. Determine the percent of confidence intervals from the class list that contain the mean u. Show your work and estimate your answer to one decimal point. Work Shown: Answer: 5. Is the percent of confidence intervals that contain the population mean u close to 90%? Check one of the following answers: Very close Somewhat close Not very close 6. Suppose we had generated 100 confidence intervals. What do you think would happen to the percent of confidence intervals that contained the population mean compared to your answer to #4? Discuss both the direction and value of percent. Why? (Explain clearly and completely!!!) 7. When we construct a 90% confidence interval, we say that we are 90% confident that the true population mean lies within the confidence interval. Using complete sentences, explain what we mean by this phrase clearly and completely. 8. Some students think that a 90% confidence interval contains 90% of the original data. a) Go back to TABLE I and highlight in yellow each of the 100 women's heights that lie within the confidence interval that you generated. Count the number of heights that you highlighted. Number of 100 women's heights that lie within YOUR confidence interval b) What percent of the 100 women's heights, to one decimal place, is this? c) Is this percent close to 90%? Check off your answer. Very close Somewhat close Not very close 9. The symbol for the random variable used as the basis to create your confidence interval is: 10. Explain clearly and completely why it does not make sense to count original data values that lie in a confidence interval. Think about the definition of the random variable that is being used in the problem? This is the heart of this lab project. Be thoughtful in your response! Include the symbol for and a discussion about the random variable being used for this problem. 11. Suppose you obtained the heights of 10 women and calculated a confidence interval from this information. Without knowing the population mean u, would you have any way of knowing for certain if your interval actually contained the value of u? Why or why not? Explain your answer clearly and completely